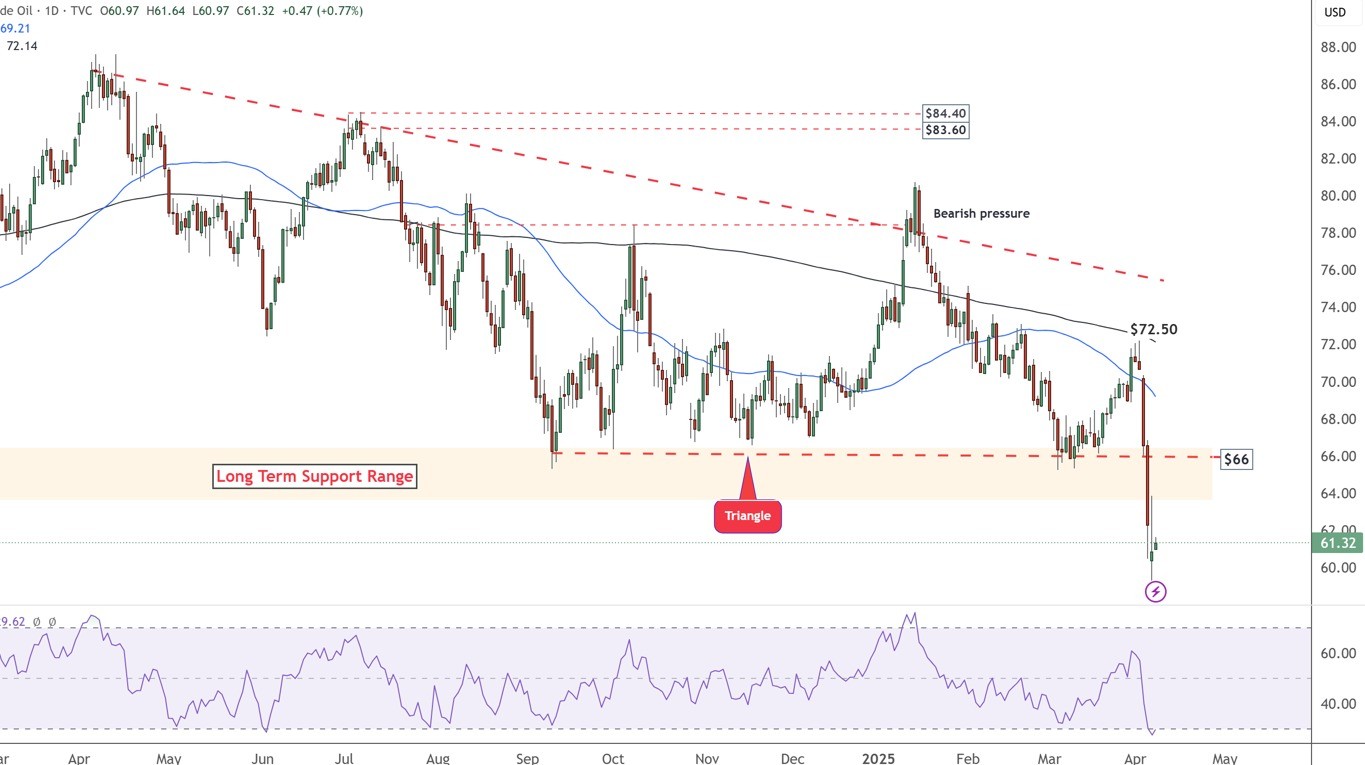
WTI Crude Oil Breaks Key Support, Extends Bearish Momentum Amid Global Demand Fears
Key Technical Highlights:
-
Support Break:
Price has broken below the long-term $65–$66 support zone, triggering a sharp selloff. This support had held for years, so breaking it is a significant bearish signal. -
Chart Pattern:
A triangle pattern was violated (red-dotted trendline), confirming bearish continuation and amplifying downside risk. -
Moving Averages:
-
50-day SMA < 200-day SMA → Bearish alignment
-
Confirms that the macro trend remains negative
-
-
Oversold Conditions:
-
Momentum indicators (likely RSI, Stochastics) are in oversold territory, suggesting potential for a short-term rebound or consolidation.
-
Fundamental Backdrop:
-
Demand Concerns:
Intensifying global trade tensions have raised fears of a recession, which could severely dent energy demand. -
Price Action:
Crude has now fallen to levels not seen in nearly four years, adding to panic-driven selling pressure.
Recent News
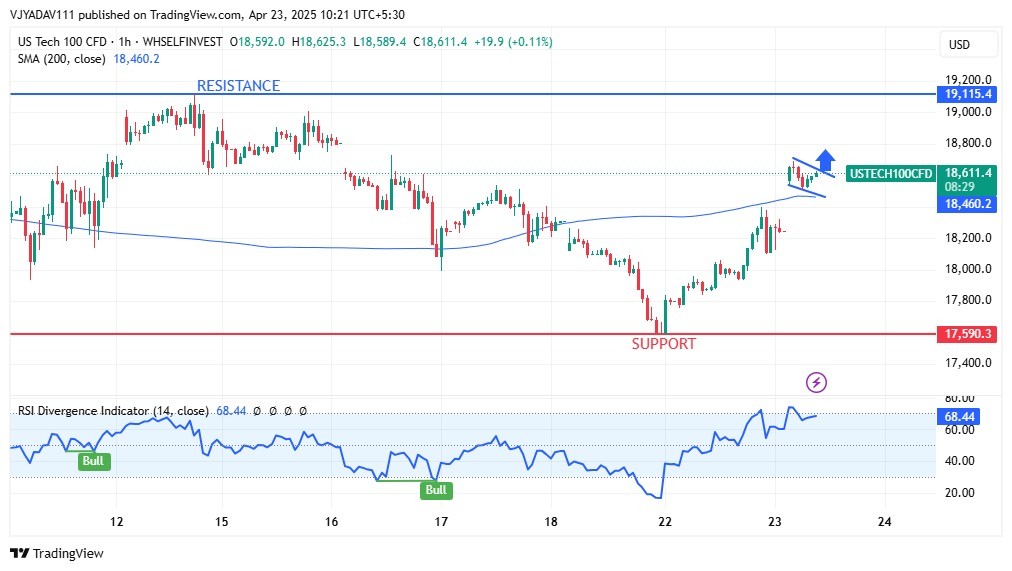
US Tech 100 Rockets Higher Breaking Barr...
April 23, 2025
Market Insights
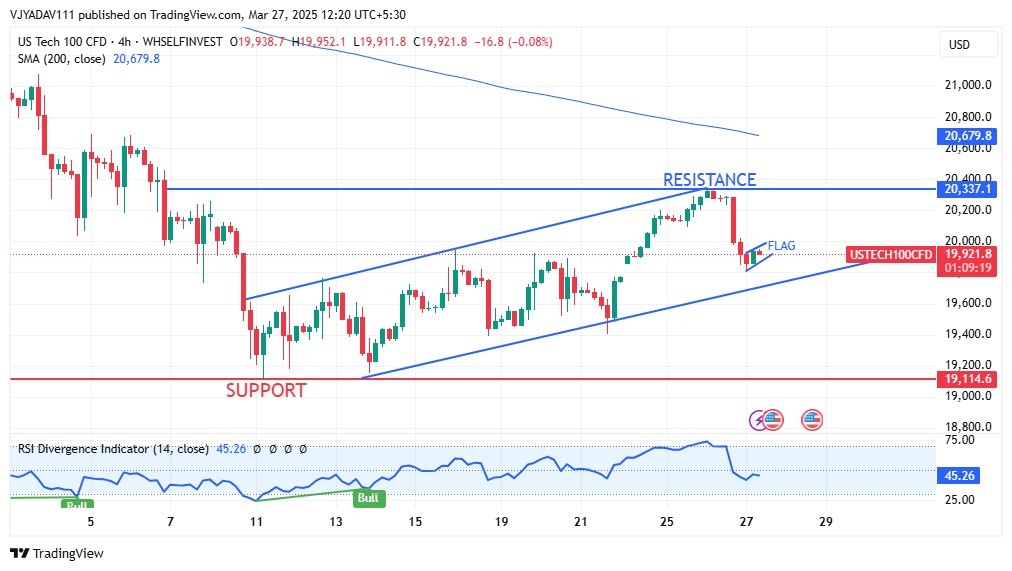
US Tech 100 forms a bearish flag near 19...
March 27, 2025
Market Insights

Time for caution in Gold & Bitcoin as Gr...
November 04, 2024
Market Insights

NASDAQ trading in a Channel
February 11, 2025
Market Insights

Gold price sticks to modest intraday gai...
November 27, 2024
Market Insights
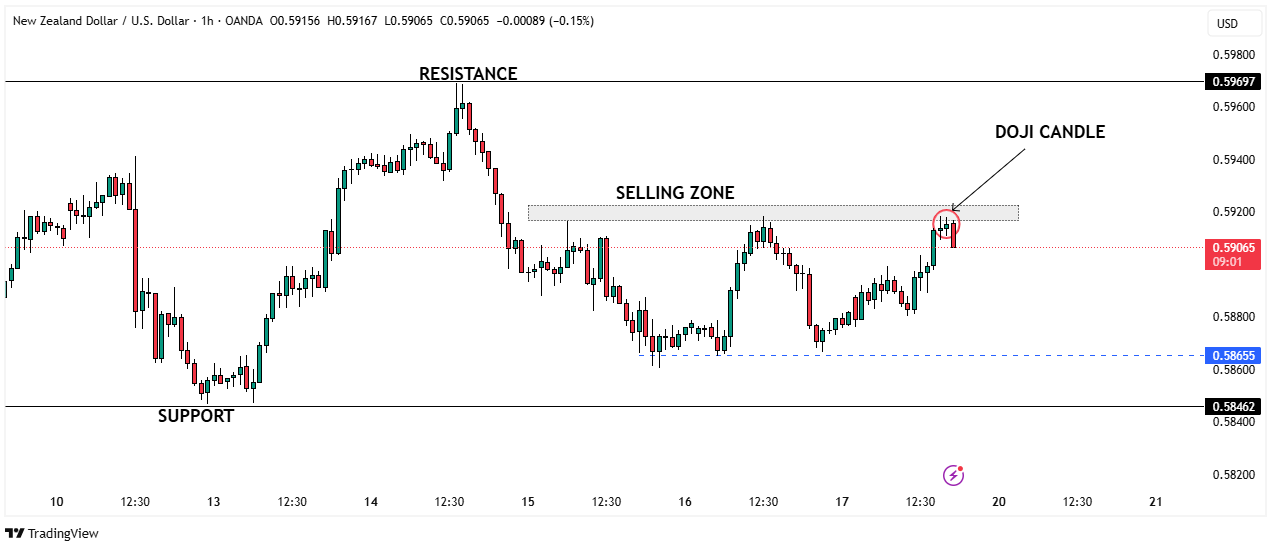
NZD/USD Rejected at Selling Zone
May 19, 2025
Market Insights