WTI climbs on US–China tariff truce; market eyes US–Russia talks, OPEC reports, and inverted H&S bullish setup
Crude oil steadied near $64.00 after rebounding from two-month lows, with traders focusing on the upcoming Trump–Putin meeting. Despite geopolitical tensions and stalled peace hopes, optimism lingers that diplomacy could ease market uncertainty. The absence of fresh US sanctions, even after Russia escalated its offensive, has kept bullish sentiment intact.
OPEC+’s larger-than-expected output hike and weak global growth outlook have been overshadowed by geopolitical risks, which continue to support prices. The market’s ability to hold gains despite oversupply concerns signals underlying buying interest, keeping the bullish bias alive.
WTI TECHNICAL OUTLOOK
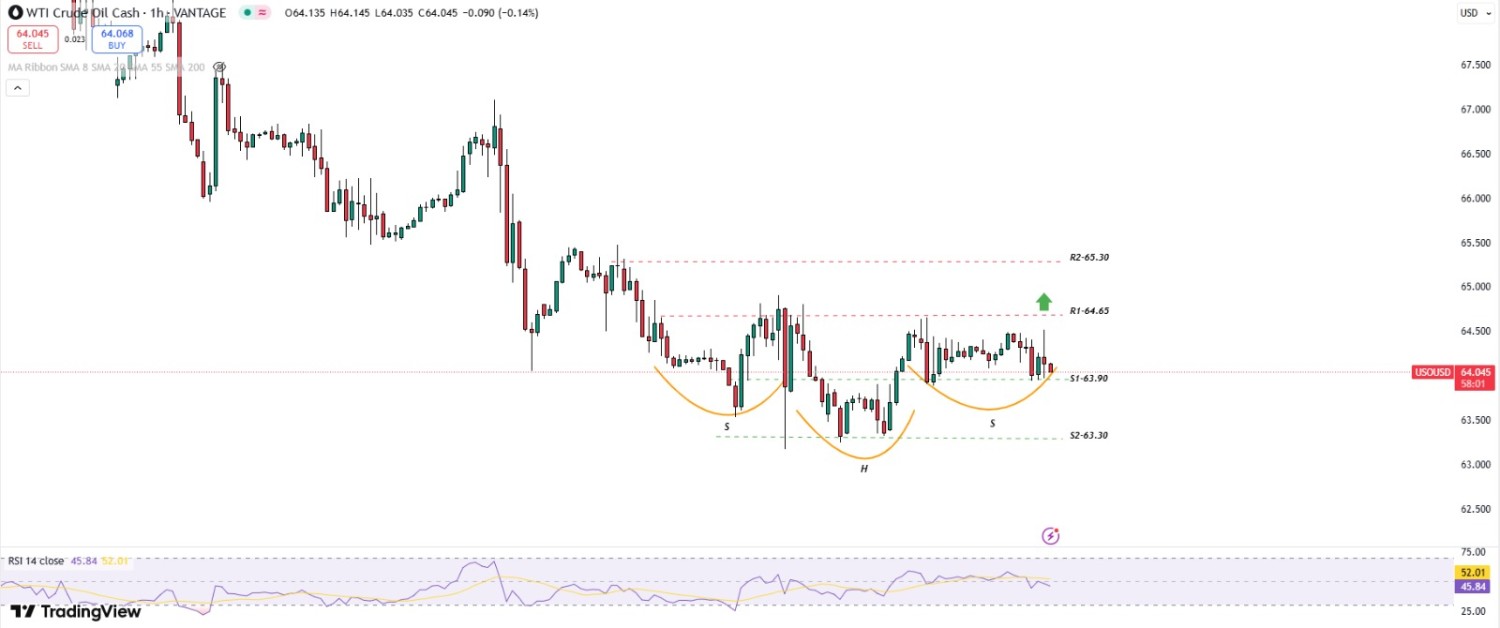
Technical Structure: WTI crude is exhibiting a short-term bullish setup despite a prevailing broader downtrend. On the daily chart, a Bullish Engulfing pattern has emerged, though prices remain capped below the 20-SMA, indicating resistance to a sustained uptrend. The 4H chart shows a Bullish Flag formation, while the 1H chart reveals an Inverted Head & Shoulders pattern, both hinting at potential breakout opportunities.
Weekly Trend: Downtrend
Intraday Trend/ Intraday Strategy: Intraday momentum favors a bullish bias, with strategies focused on buying near support or on confirmed breakouts.
Major Support: $63.90, $63.50, and $62.35
Major Resistance: $64.65, $65.00, and $65.50
Recent News
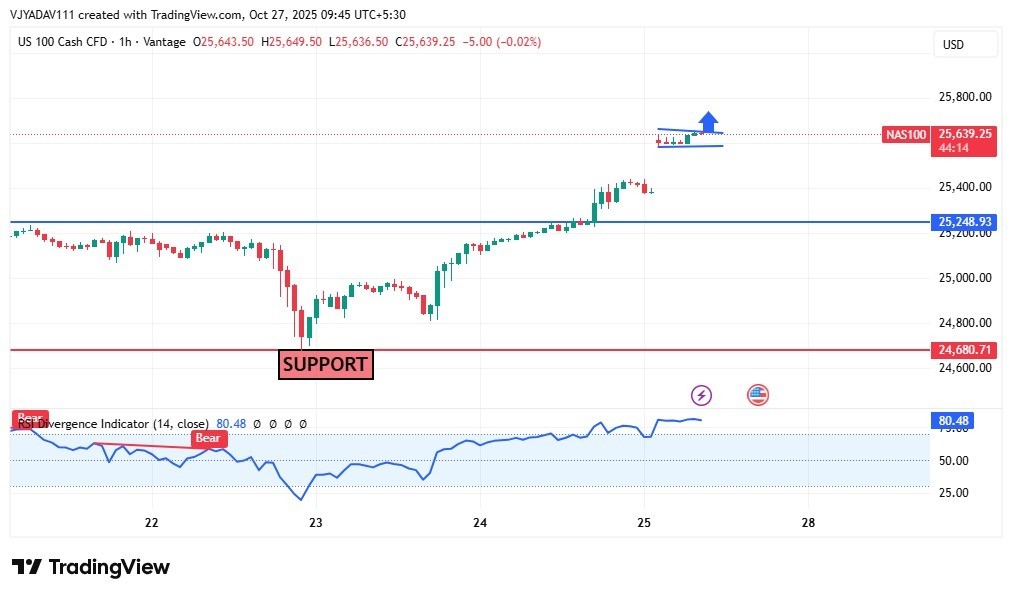
NASDAQ trading on all time higher levels...
October 27, 2025
Market Insights
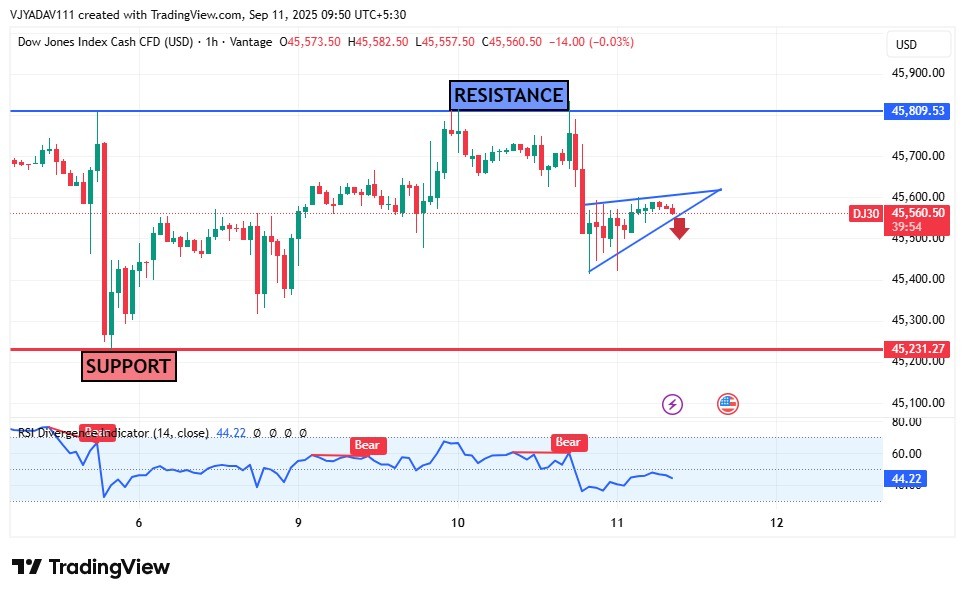
Dow Jones Faces Bearish Pressure Near 45...
September 11, 2025
Market Insights
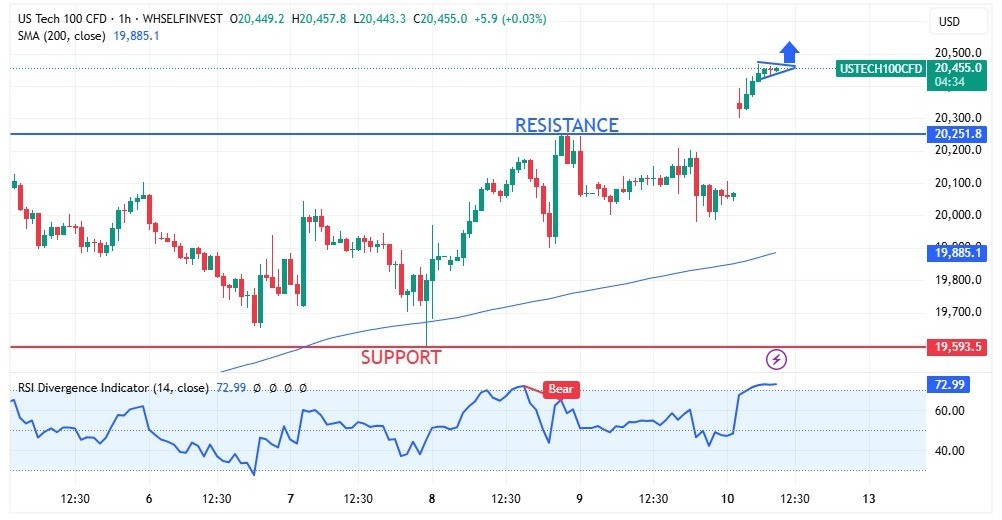
NASDAQ gave resistance breakout and afte...
May 12, 2025
Market Insights
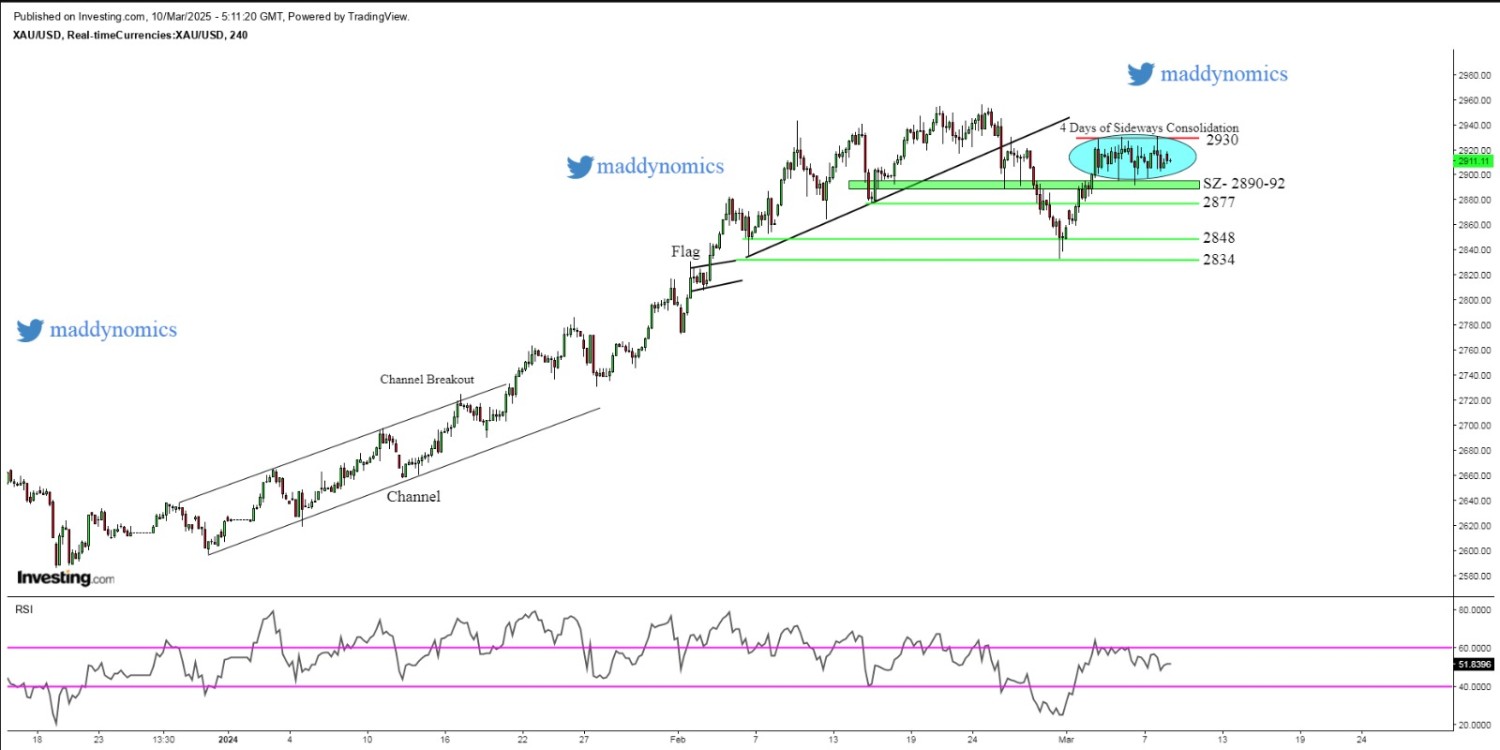
Gold price consolidates within a tight r...
March 10, 2025
Market Insights
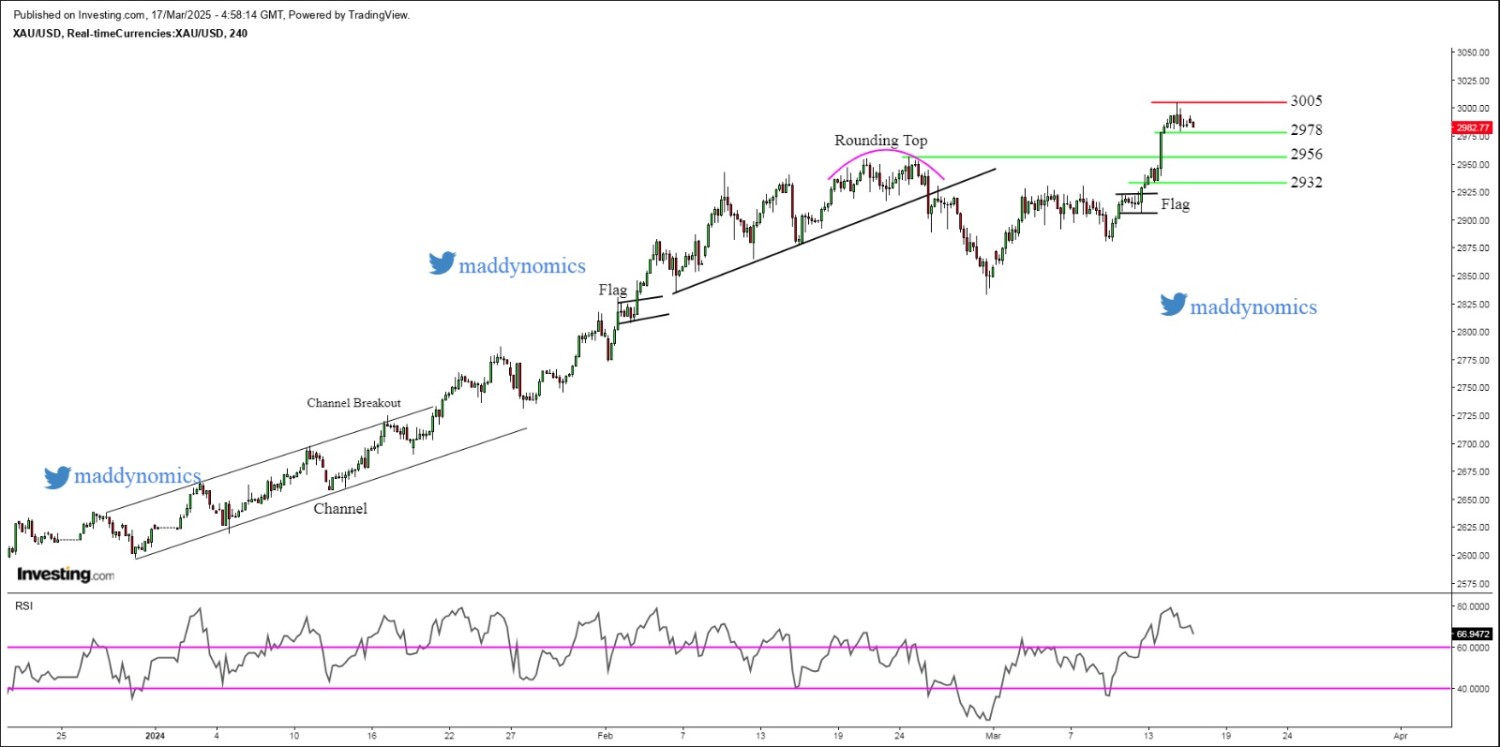
Gold stays firm after achieving a fresh...
March 17, 2025
Market Insights
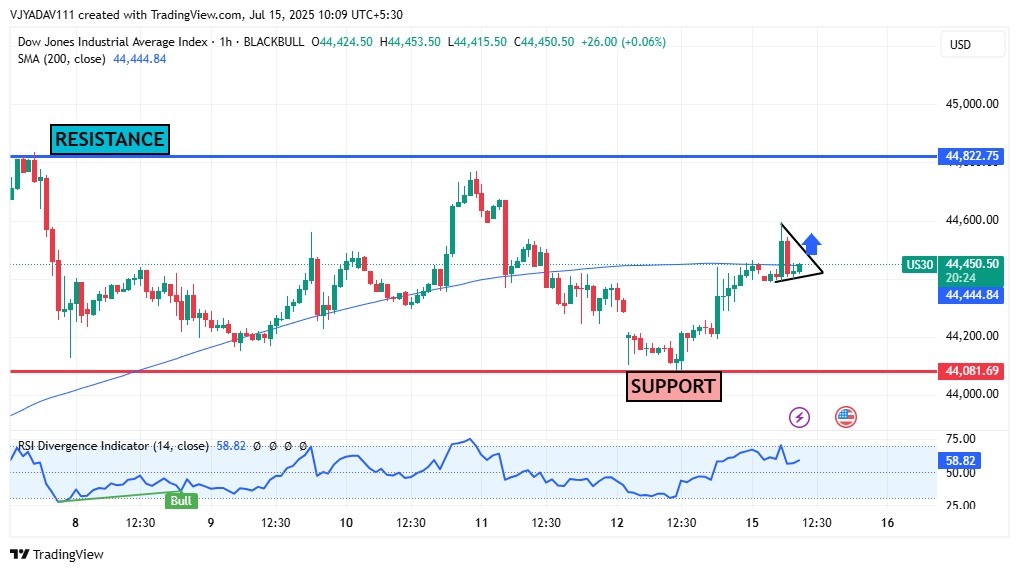
US30 Forms Bullish Pennant Near Key SMA...
July 15, 2025
Market Insights