V-shaped recovery in Gold! The yellow metal rallies back to $2920.
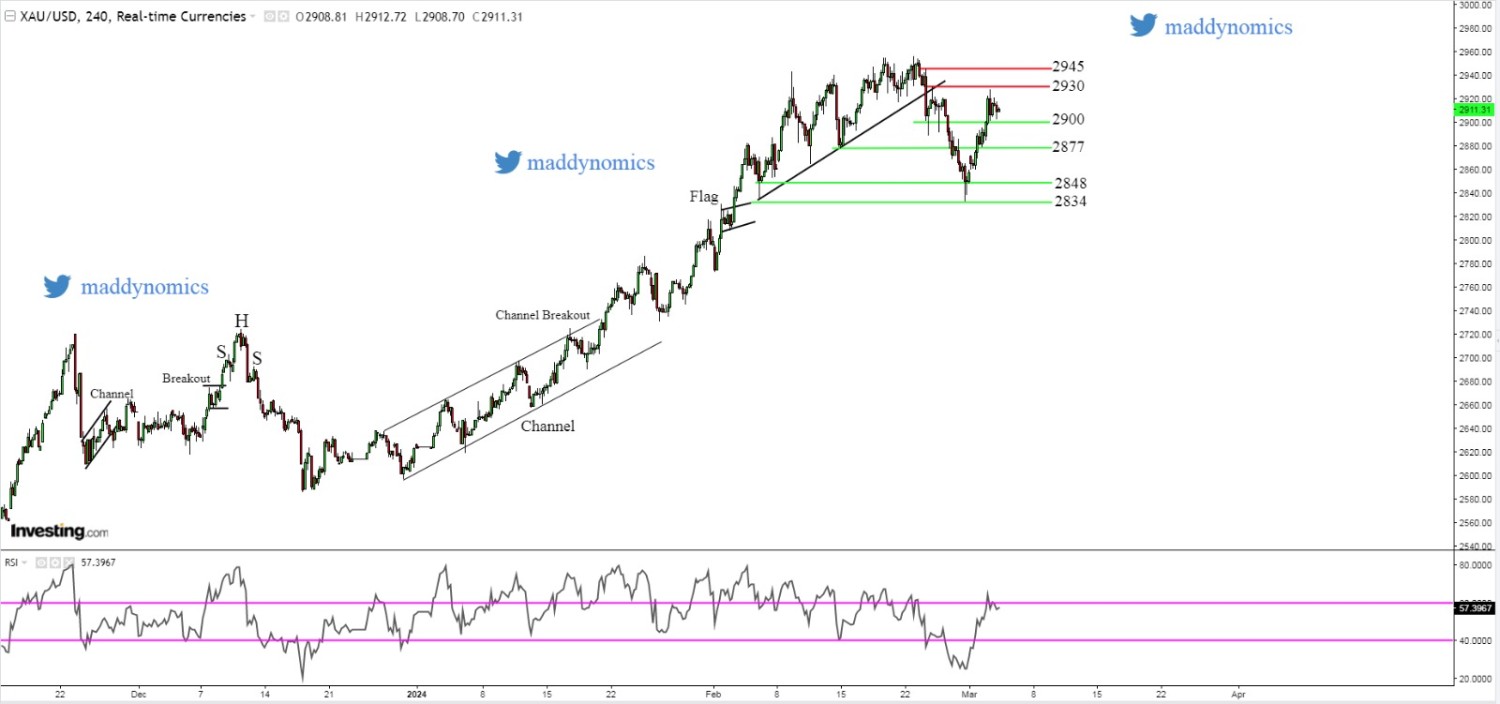
It seems like bulls are not yet ready to give up as Gold prices strongly reversed after hitting a low of 2900 in Tuesday's session. Uncertainty looming around a peace deal between Russia and Ukraine and an ongoing trade war boost the demand for this safe haven asset. A strong bullish candle on the daily chart of Gold suggests further positive momentum along with an inverted head and shoulder pattern formed on 4H timeframe. Weekly trend is bullish to neutral so buying on support and selling on resistance strategy seems fit. Crucial support lies at 2901, 2895 & 2887 while important resistance levels to watch out for are 2915, 2921 & 2928.
Recent News

US30 Consolidates Between Key Resistance...
June 10, 2025
Market Insights

USTECH100 Forms Wedge Pattern Near Suppo...
February 26, 2025
Market Insights
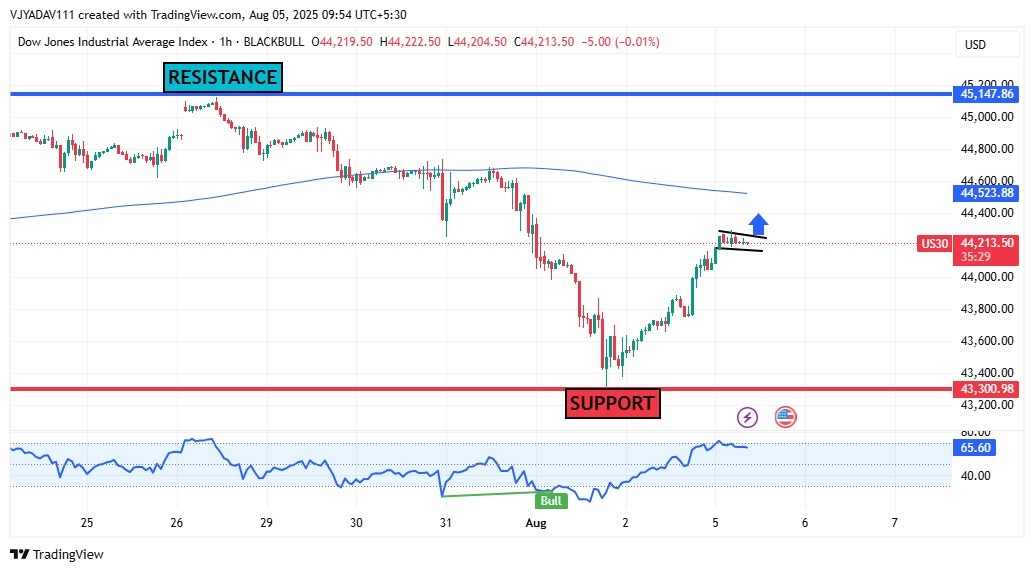
US30 Forms Bullish Flag Near 44,200 – Ey...
August 05, 2025
Market Insights
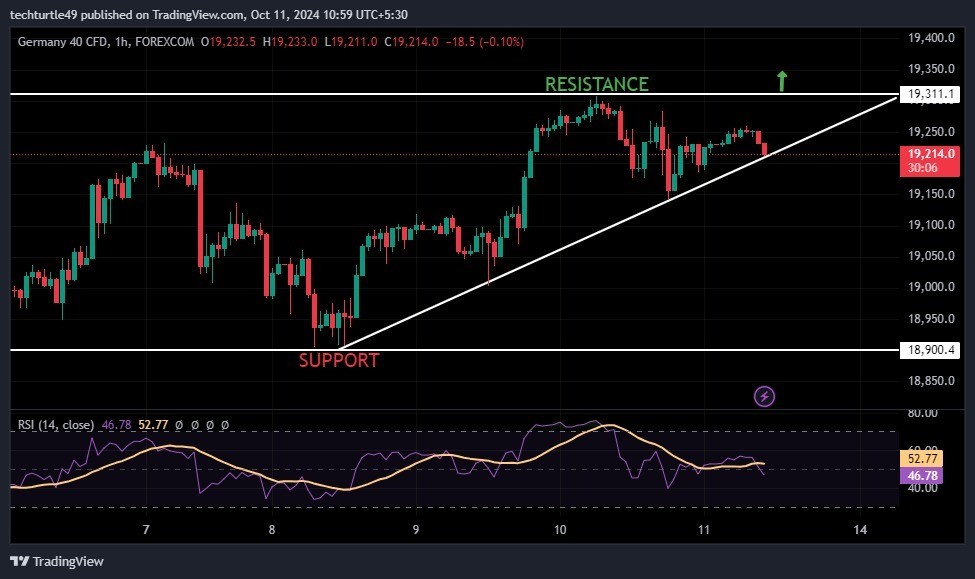
GER40/DAX Analysis
October 11, 2024
Market Insights

GBPJPY making bearish Flag
November 25, 2024
Market Insights
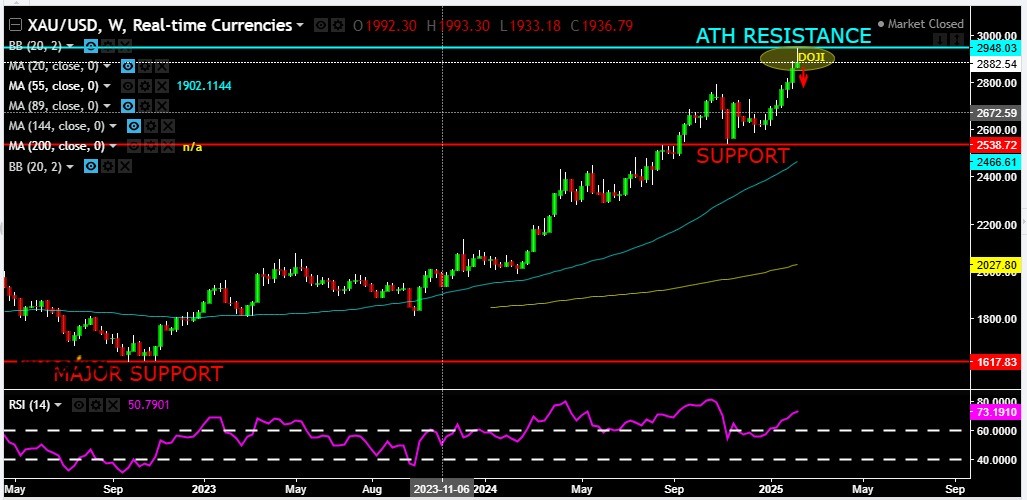
GOLD Profit Booking?
February 15, 2025
Market Insights