Natural Gas Daily Chart – Cup and Handle Pattern
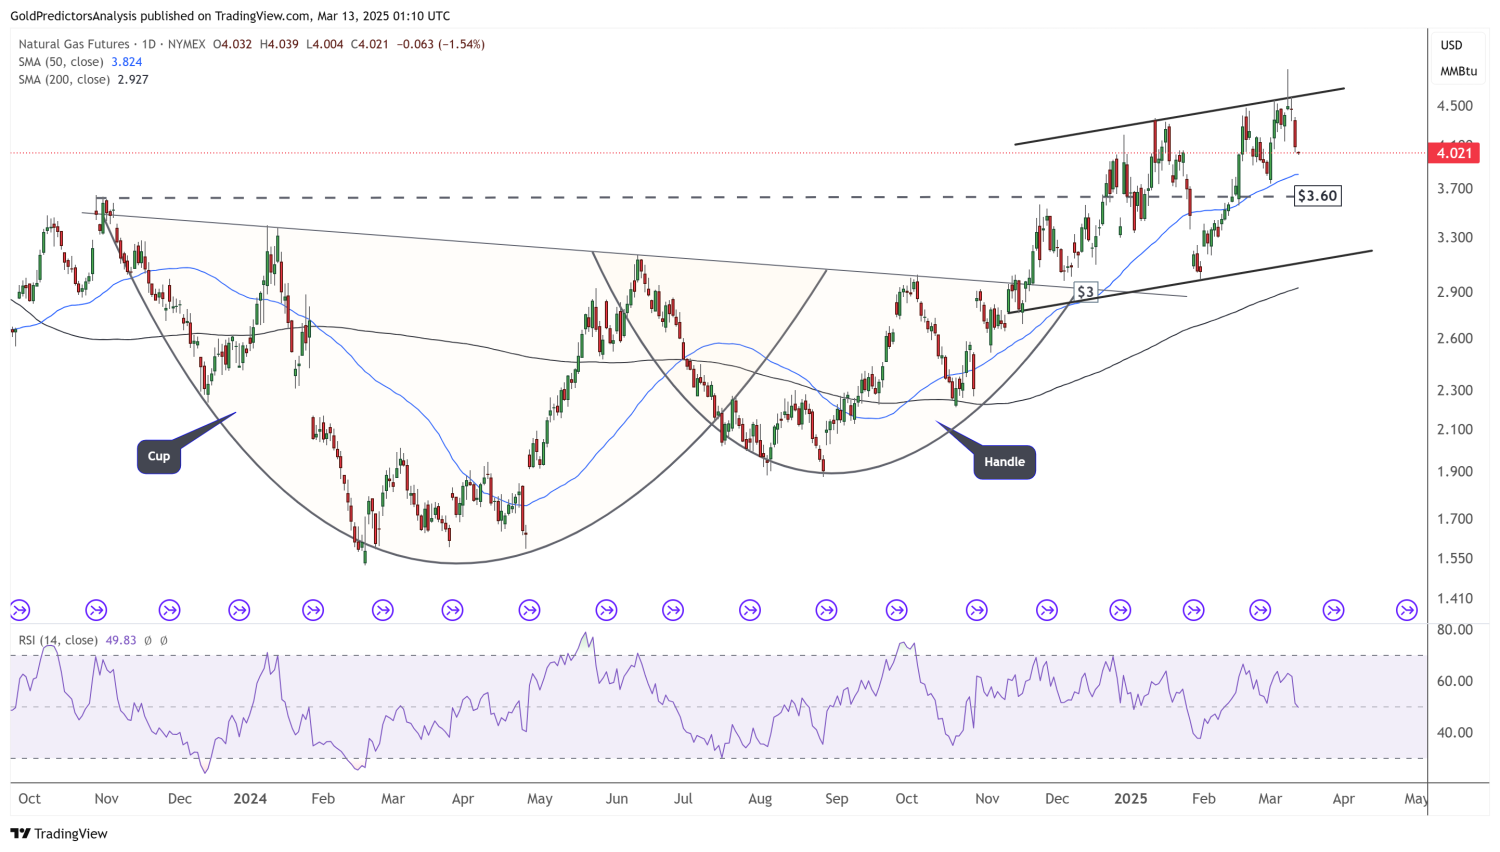
The daily chart of Natural Gas (NG) suggests a classic cup and handle formation, a bullish continuation pattern indicating further upside potential. The price recently hit resistance and pulled back, forming the "handle" phase.
- Support: Holding above $3 is crucial for sustaining the pattern.
- Breakout Zone: A decisive move above $5 would confirm the breakout, opening doors for further gains.
- Trend Outlook: As long as NG remains above $3, the broader trend favors bulls.
Recent News
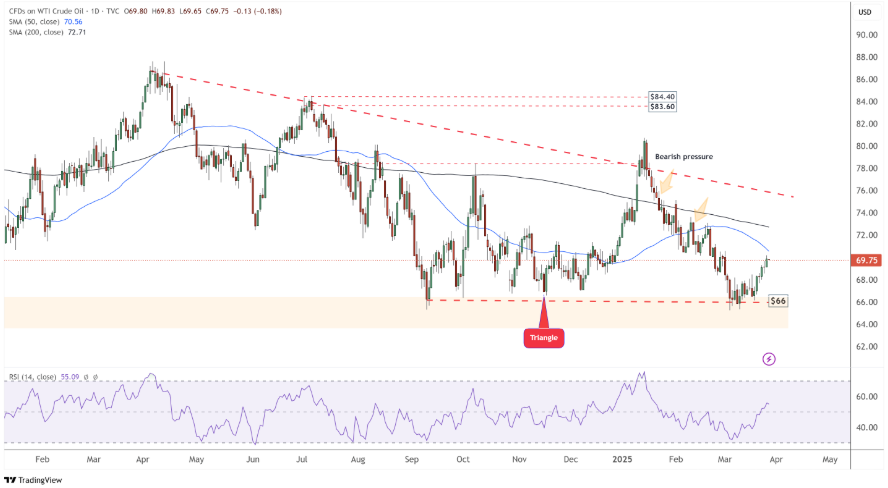
WTI Crude Oil Gains Momentum Amid Supply...
March 27, 2025
Market Insights
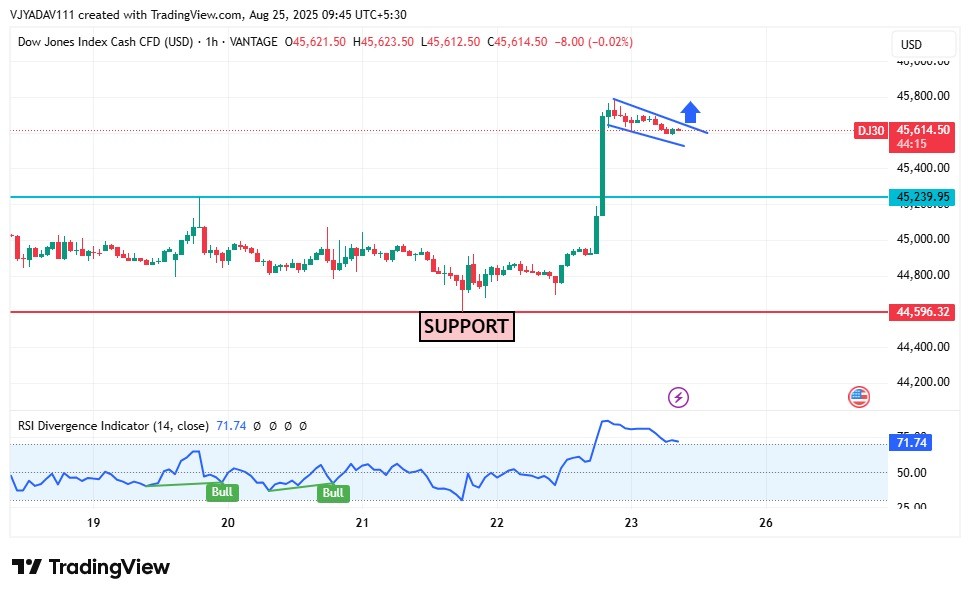
Dow Jones Forms Bullish Flag Above 45,60...
August 25, 2025
Market Insights
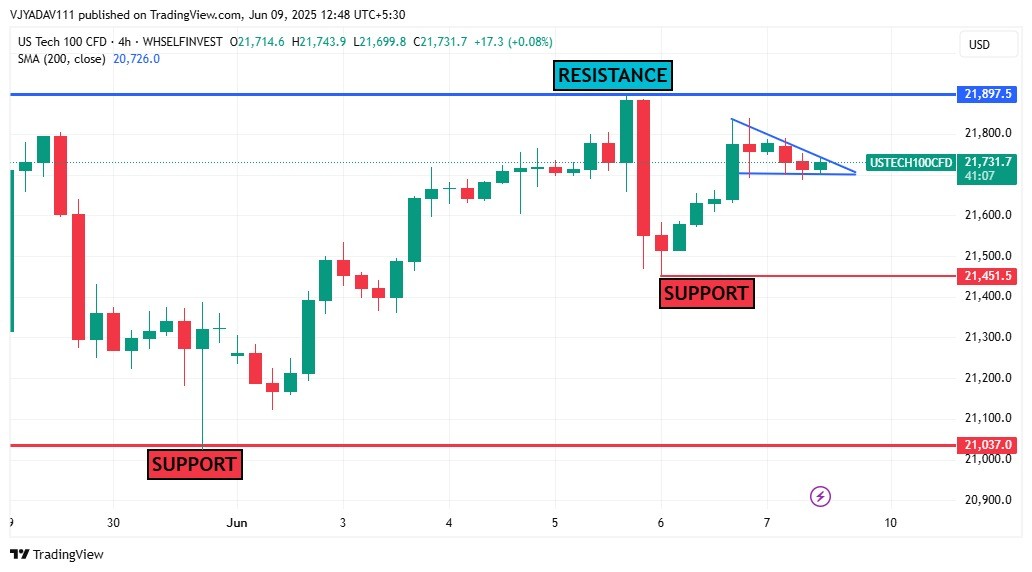
US Tech 100 Testing Key Levels Resistanc...
June 09, 2025
Market Insights
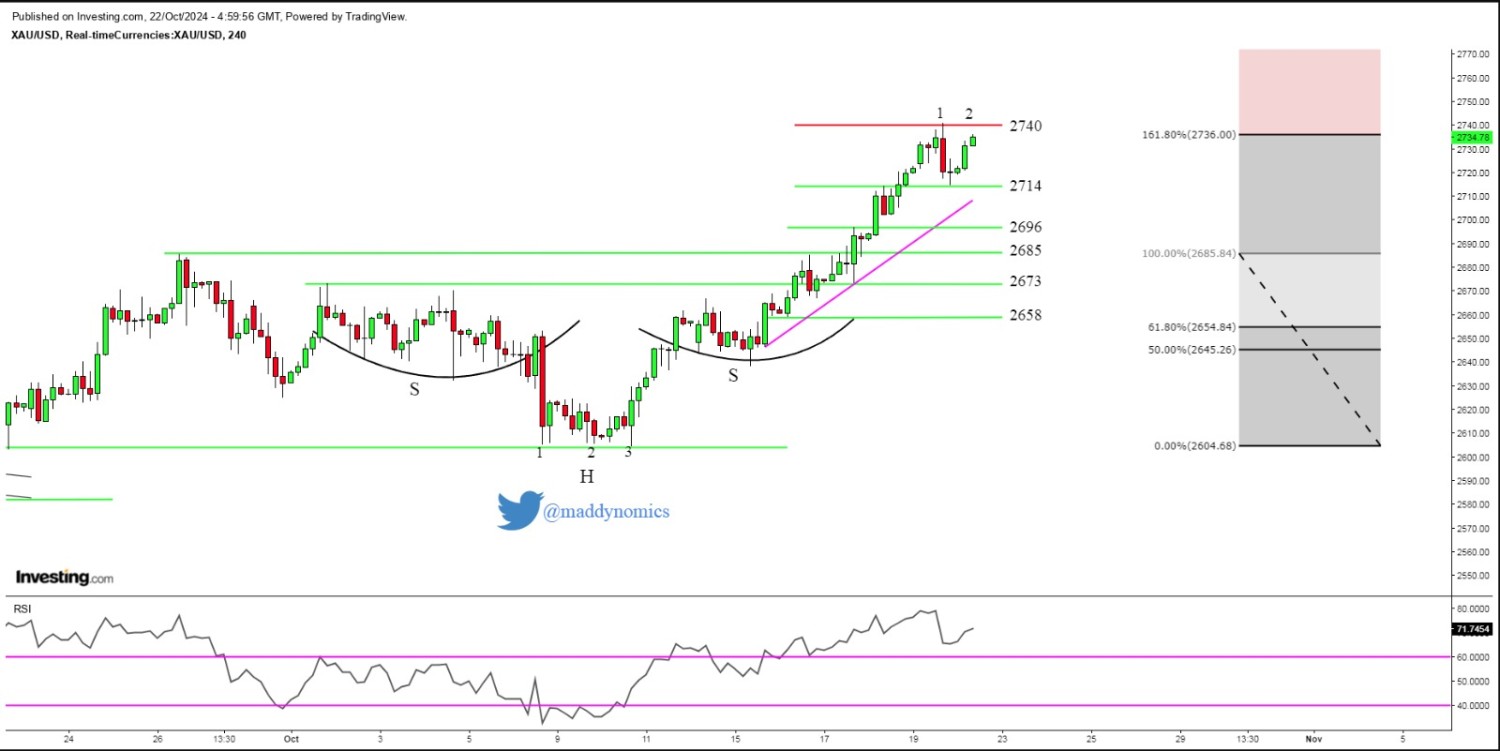
Gold may halt rally after 8 Days of Buyi...
October 22, 2024
Market Insights
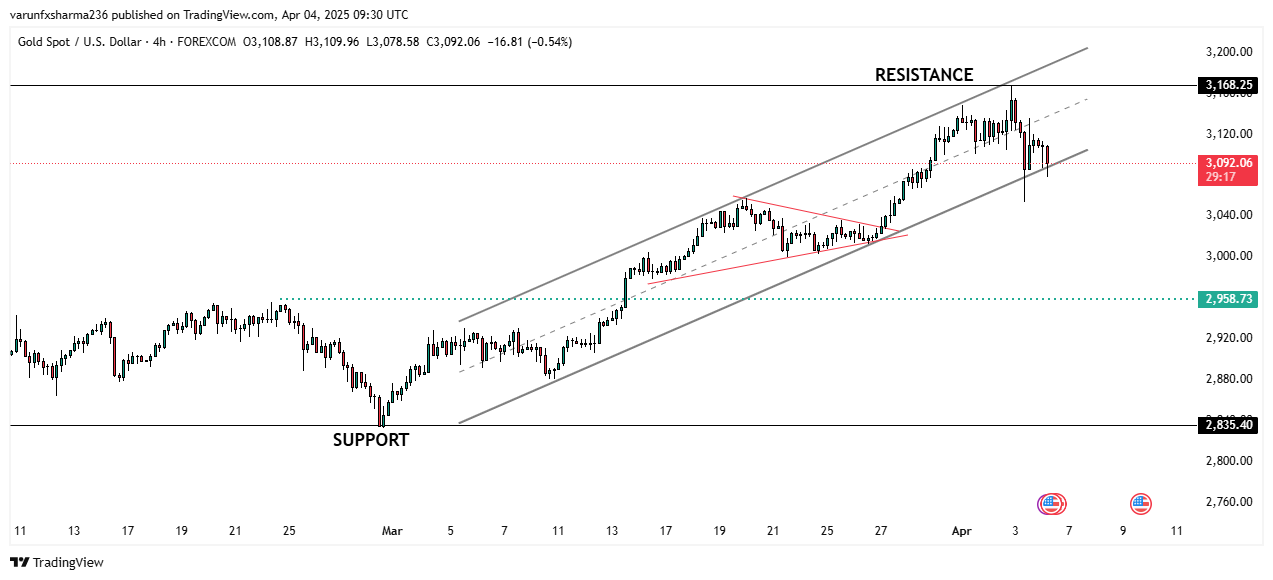
GOLD TECHNICAL OUTLOOK: Consolidation Wi...
April 04, 2025
Market Insights

NASDAQ still bull after correction in S&...
October 16, 2025
Market Insights