Natural Gas 4 Hour Chart Pinpointing the Wedge Breakout with Key Support and Resistance Levels
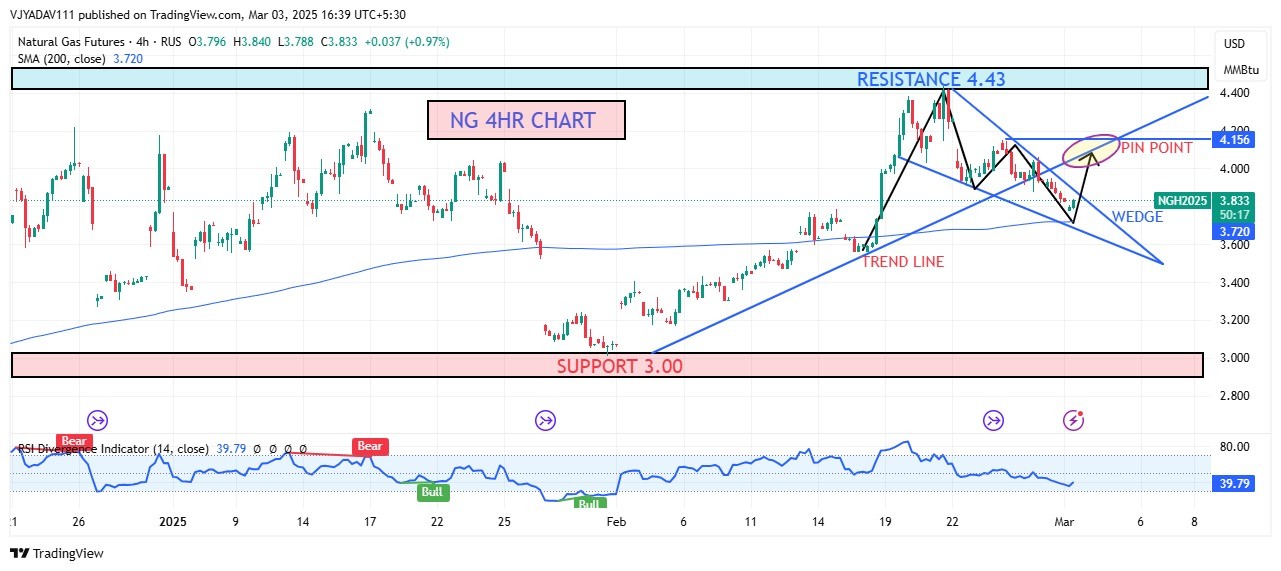
NATURAL GAS (NG) was down on Monday morning after testing the high level of $ 4.43 in the last weekly trading session as US utilities withdrew 261 billion cubic feet (bcf) of natural gas from storage in the week ending February 21, 2025, reducing total inventories to 1,840 bcf. The withdrawal was nearly in line with market expectations of 256 bcf.
Recent News
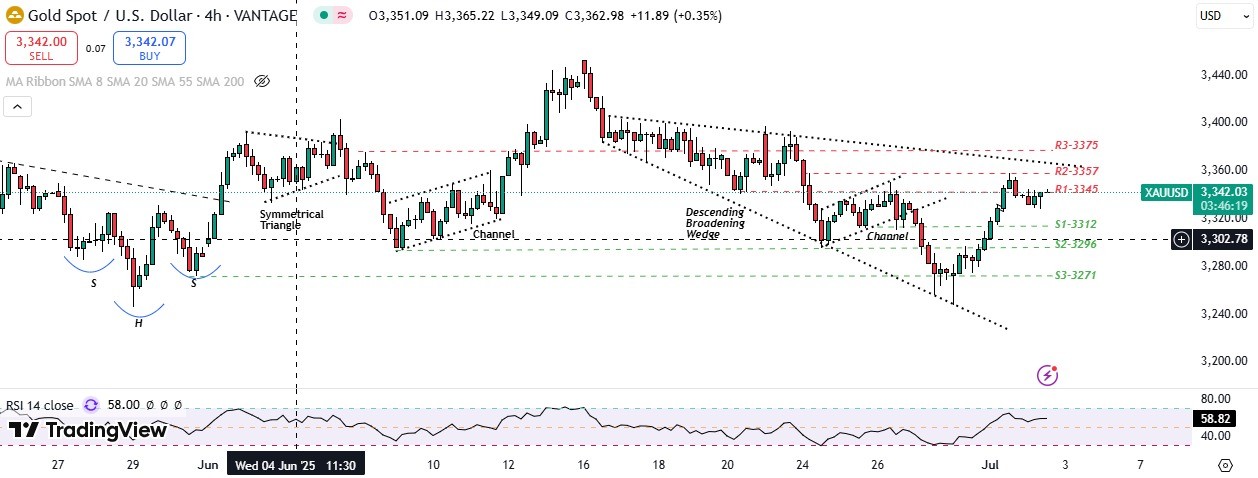
Gold holds steady below one-week high; b...
July 02, 2025
Market Insights
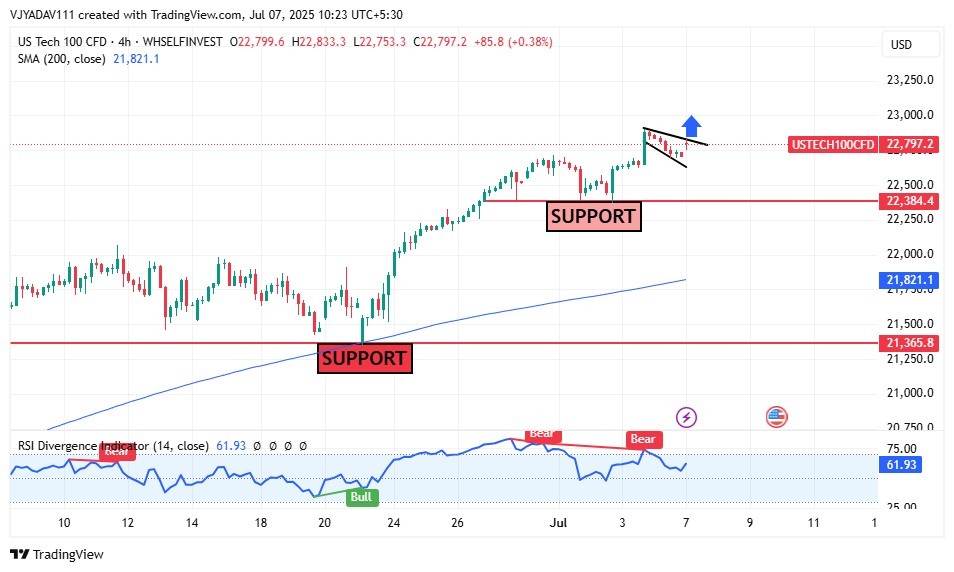
US Tech 100 Eyes Bullish Breakout Above...
July 07, 2025
Market Insights

Bitcoin Weekly Forecast: New high of $10...
November 16, 2024
Market Insights
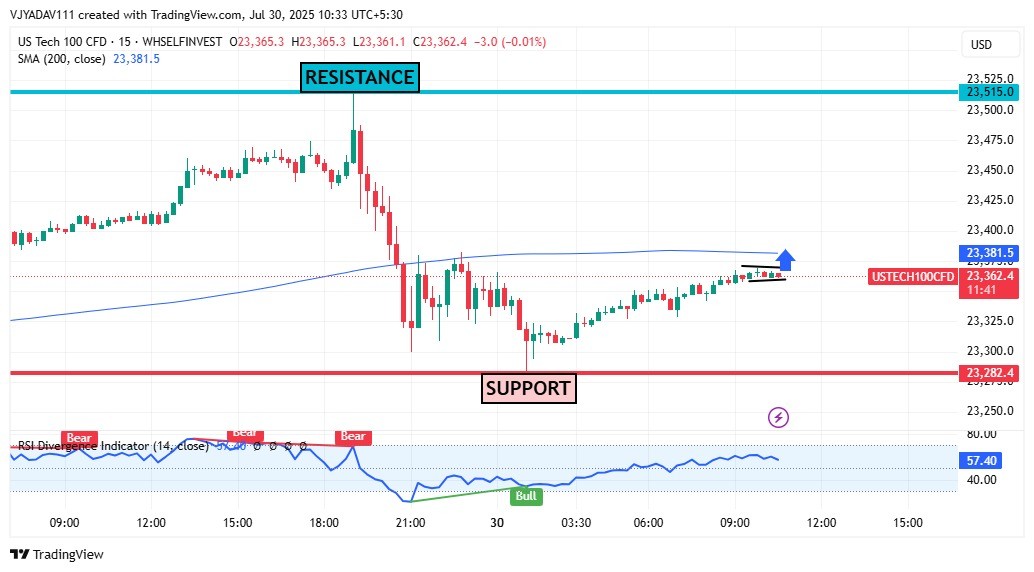
US100 Eyes 200-SMA Breakout – Bullish Mo...
July 30, 2025
Market Insights
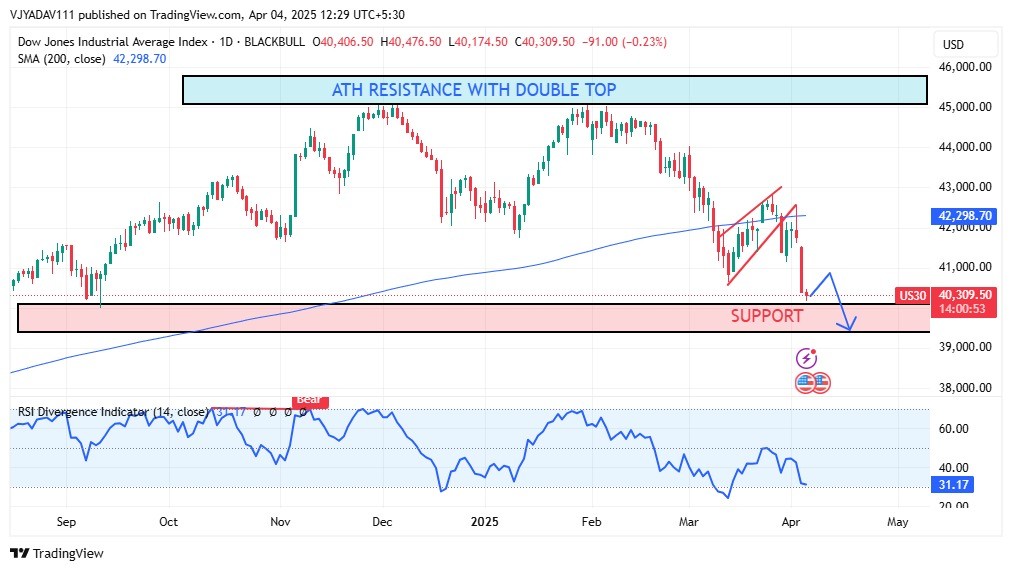
DOW JONES FACES STRONG SELL OFF AFTER DO...
April 04, 2025
Market Insights
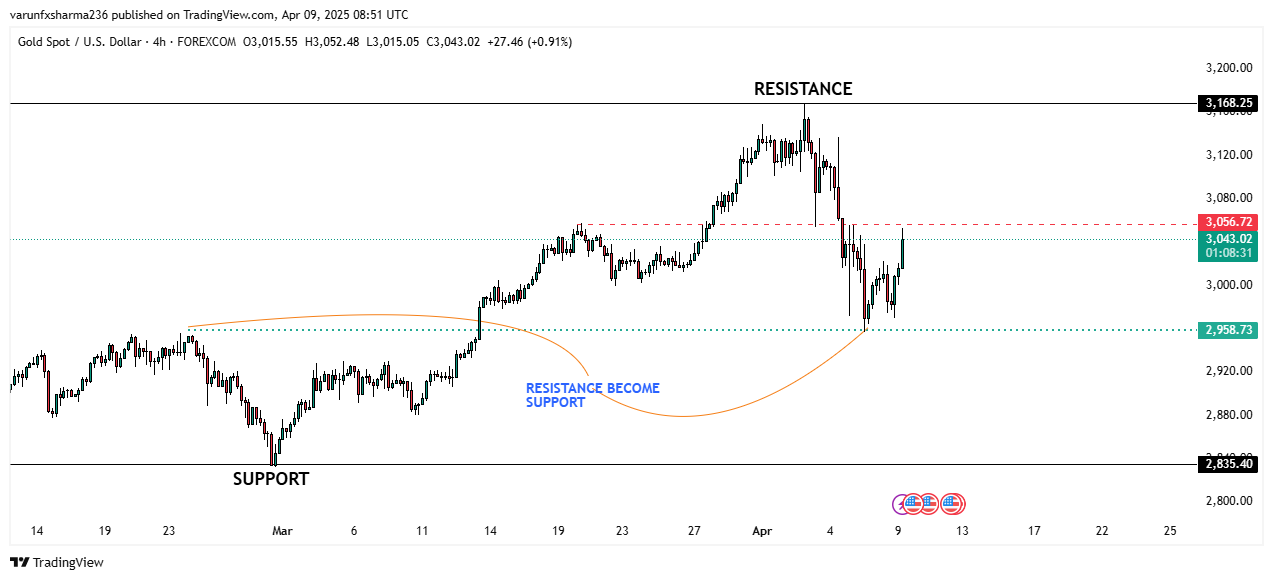
Gold Ignites as Tariff Fears Fuel Safe-H...
April 09, 2025
Market Insights