Nasdaq/US 100 Analysis
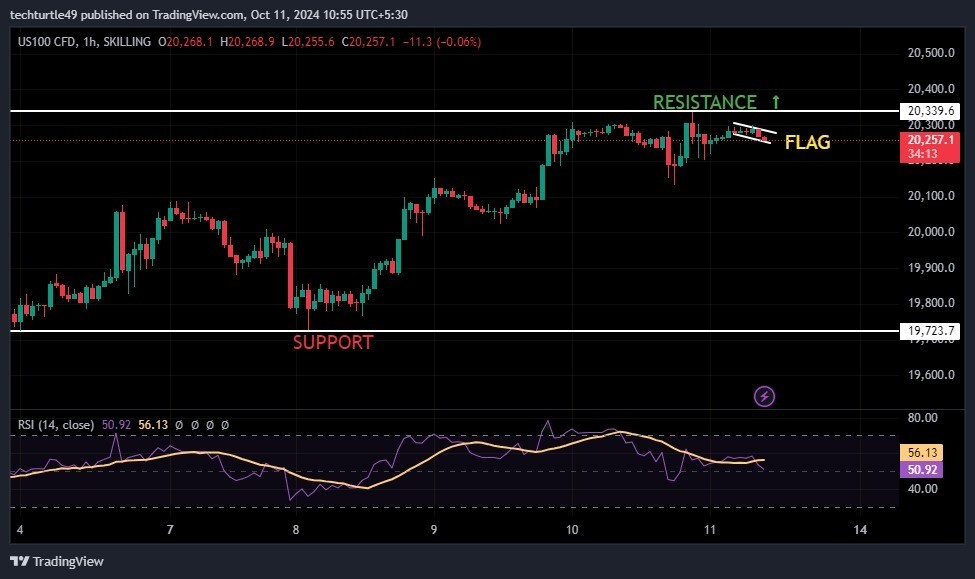
Technical Structure NASDAQ SPOT: Making bullish pattern in 4 hr time frame.
Trend: BULLISH INTRADAY
Action: BUY ON RESISTANCE BREAKOUT
R3: 20420
R2: 20360
R1: 20310
Pivot D : 20257
S1: 20200
S2: 20150
S3: 20090
Recent News
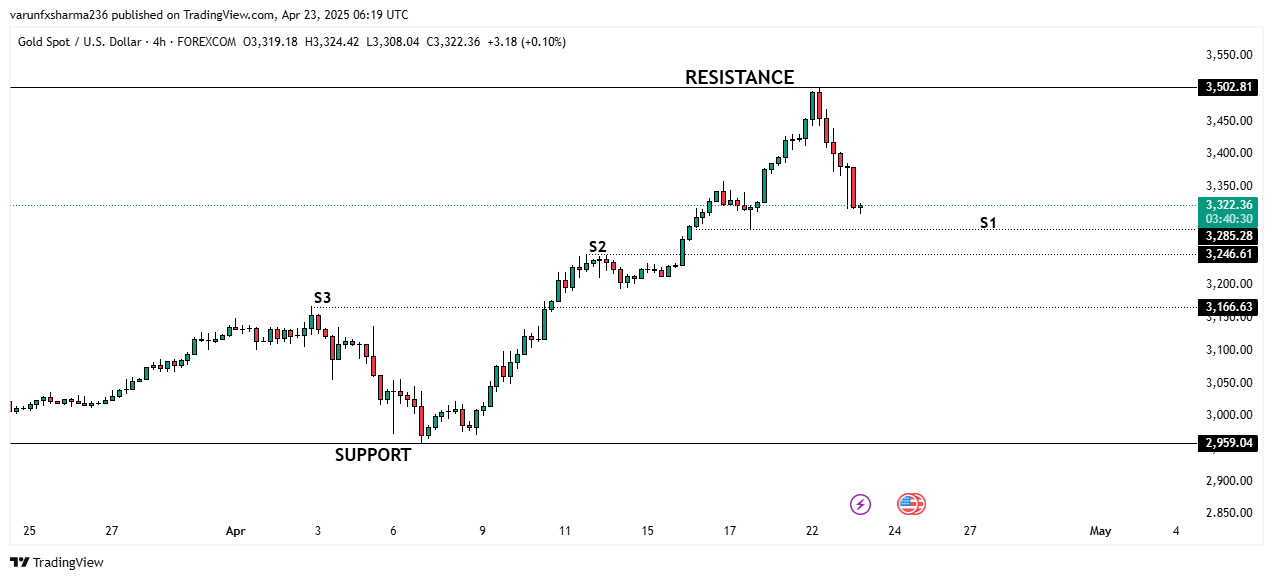
Gold Retreats from Record Highs as Trade...
April 23, 2025
Market Insights

Gold Price Outlook: Modest Gains Ahead
November 20, 2024
Live Charts

GBPJPY fall after Retail sales and PMI d...
November 22, 2024
Market Insights

Gold prices ease ahead of 'Liberation Da...
April 02, 2025
Market Insights
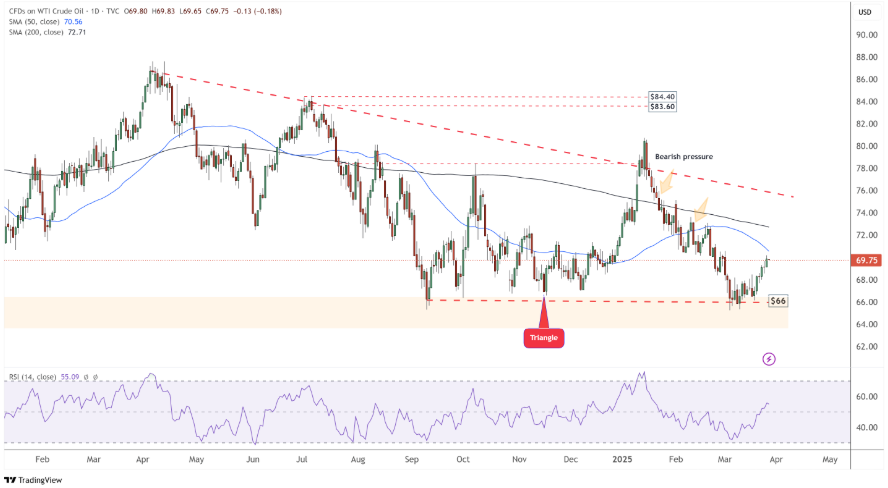
WTI Crude Oil Gains Momentum Amid Supply...
March 27, 2025
Market Insights
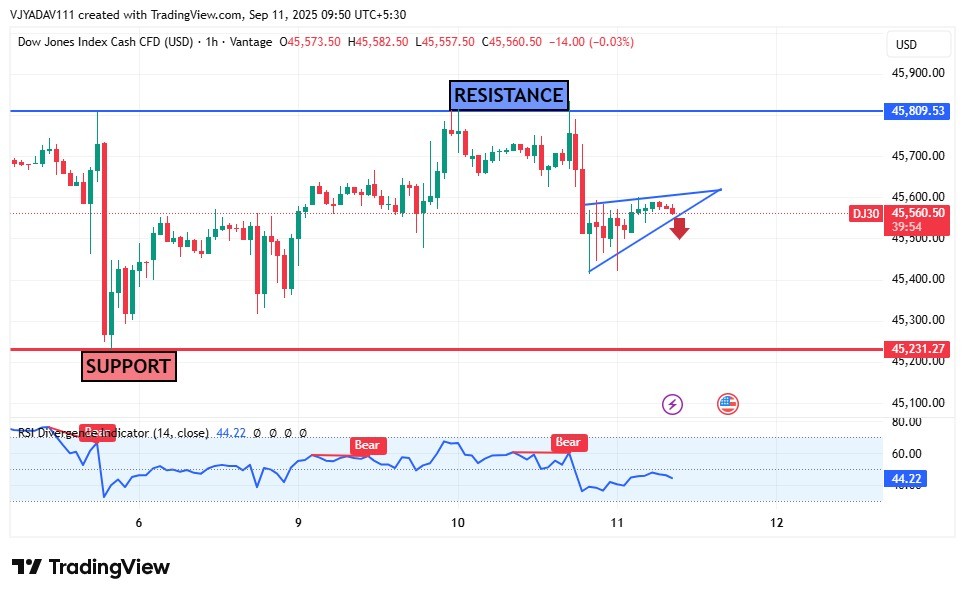
Dow Jones Faces Bearish Pressure Near 45...
September 11, 2025
Market Insights