Gold slips below $3,340 as strong US data dims Fed rate cut hopes
Gold regained footing above $3,300 after dipping early in the week, as bears were struggling to maintain control amid cautious market sentiment driven by U.S. tariff uncertainty. Technical signals also suggest bulls are stepping in around key levels, reflecting hesitation among sellers .
Looking ahead, upcoming U.S. inflation data and trade policy developments—especially evolving tariff headlines—are expected to shape gold’s direction in the near term. While tighter Fed rate-cut expectations and a firmer dollar could cap gains, renewed safe-haven demand from trade tensions might support further upside if risk sentiment weakens.
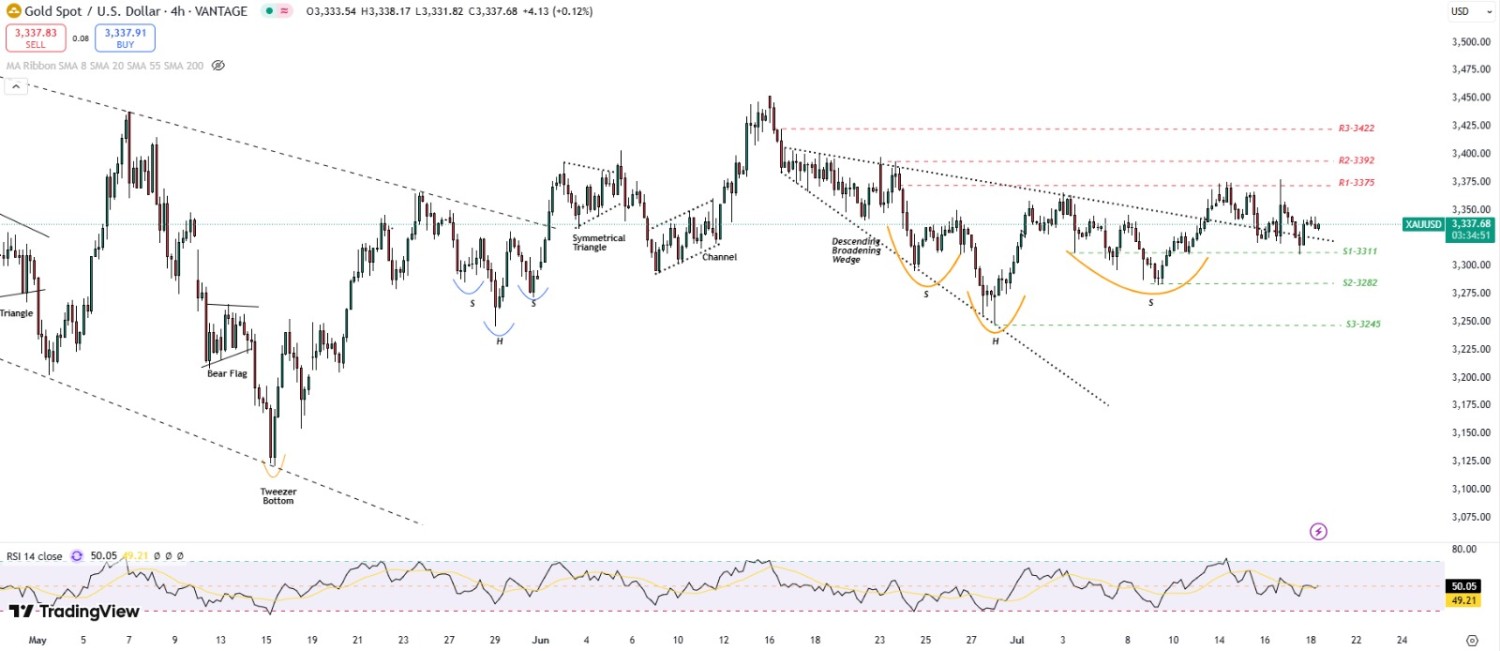
XAU/USD TECHNICAL OVERVIEW
Technical Structure: Gold remains in a neutral weekly trend, showing signa of indecision as technical structures reveal mixed signals. On the daily chart, a Hanging Man pattern has emerged near the 20-SMA, suggesting potential weakness if follow-through selling occurs. The 4-hour chart displays a Doji, reflecting market hesitation, while the 1-hour timeframe shows a Bearish Flag, indicating the possibility of a continuation to the downside.
Weekly Trend: Neutral
Intraday Trend/ Intraday Strategy: The intraday bias remains Bearish to Neutral and favours the strategy of Selling on Resistance and Selling on Support Breakdown.
Major Support: 3330, 3311, 3295
Major Resistance: 3345,
Recent News
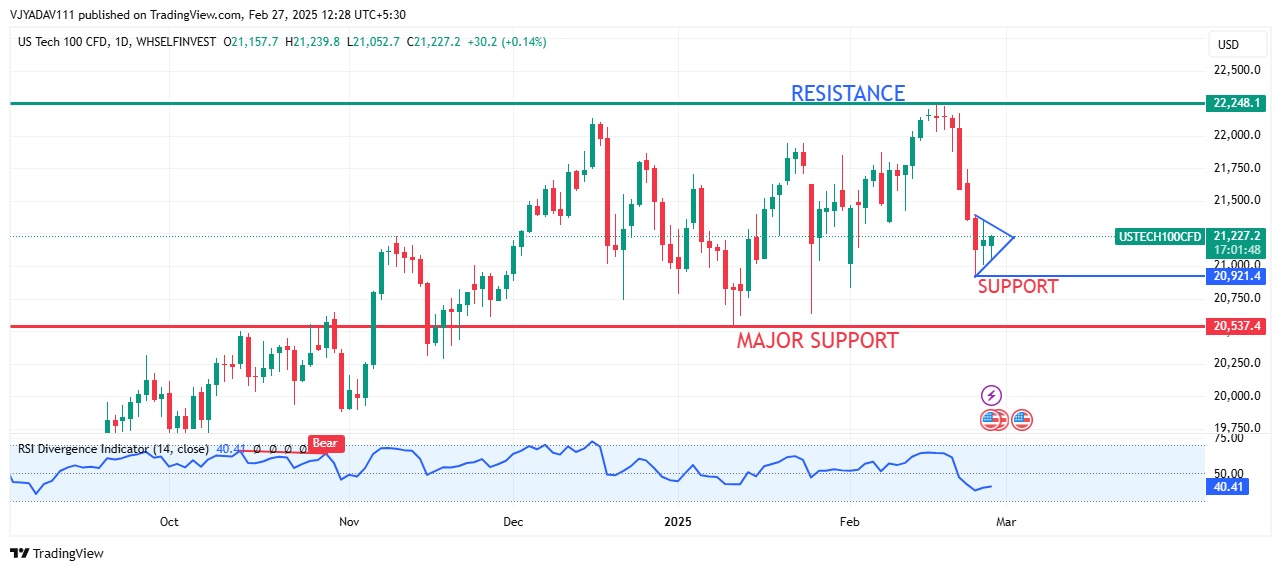
NASDAQ tumbles sharply from its all time...
February 27, 2025
Market Insights

Gold Holds Decline on Easing Mid-East Te...
November 26, 2024
Live Charts
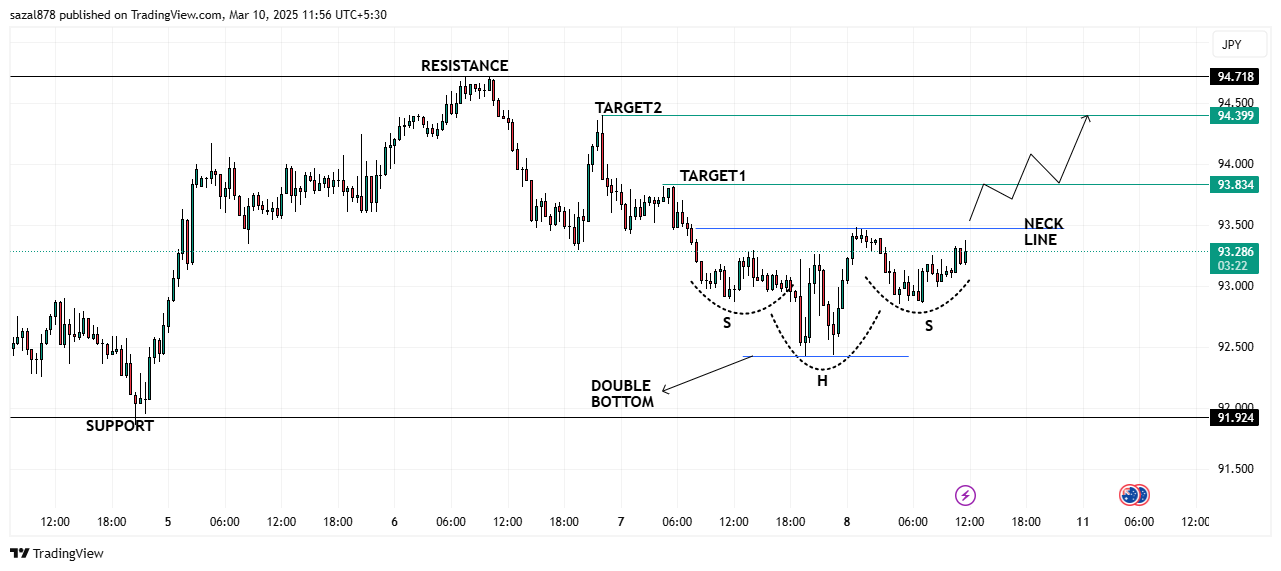
AUDJPY Bullish Reversal Pattern: Head &...
March 10, 2025
Market Insights

Gold price hovers near $3,300 amid Fed c...
July 29, 2025
Market Insights
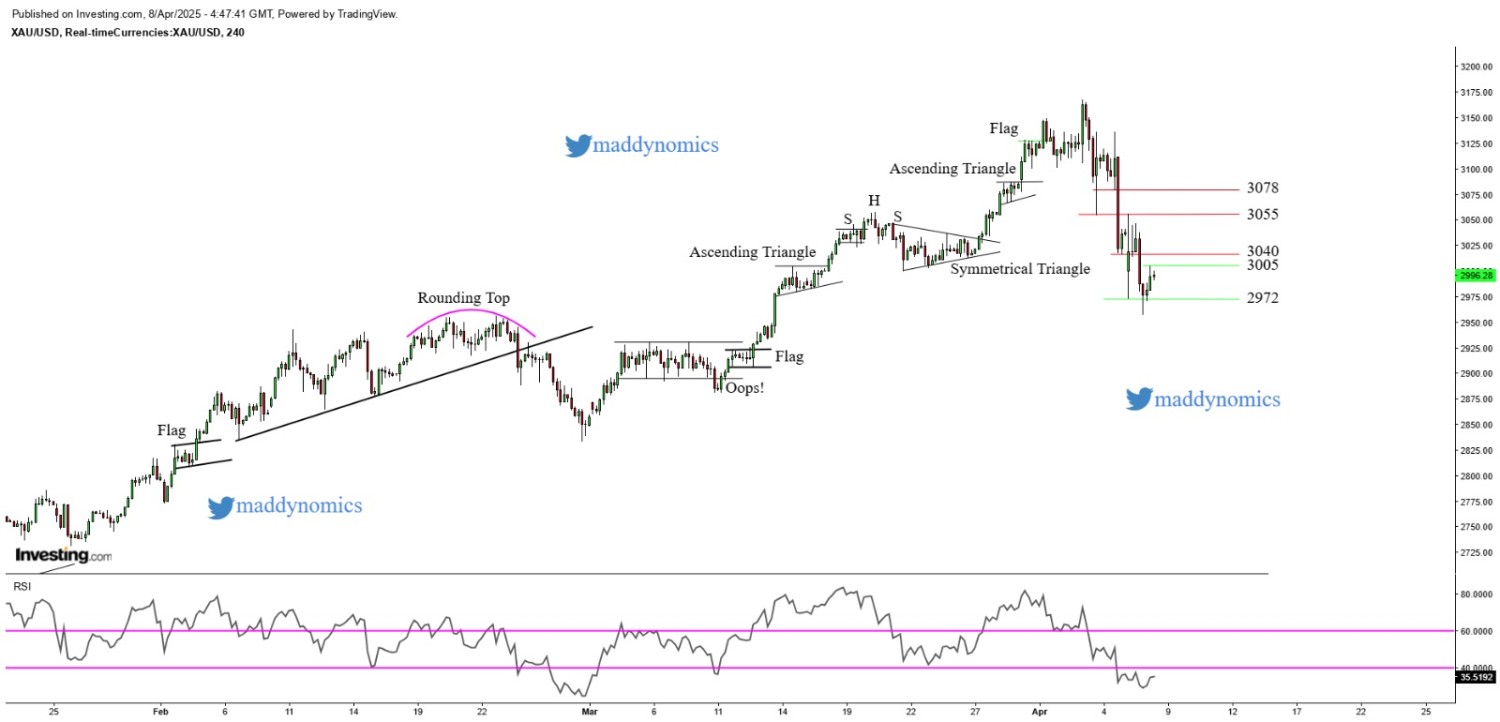
Gold climbs to $3000 but scope for gains...
April 08, 2025
Market Insights
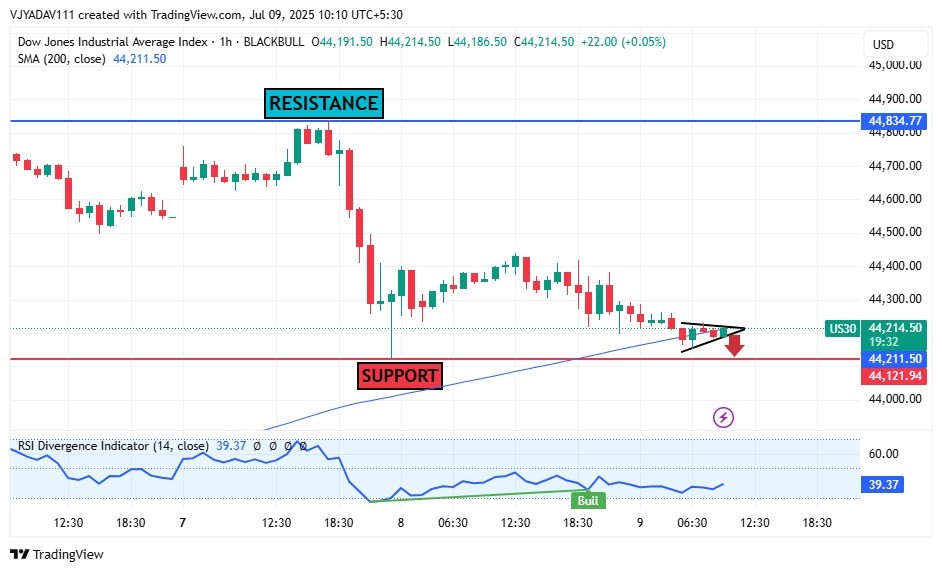
Dow Jones (US30) Struggles Below 200 SMA...
July 09, 2025
Market Insights