Gold ends up in the negative territory amid reducing safe haven demand: Head & Shoulder pattern adds to the bearish bias
Gold prices extended their decline on Thursday, slipping to a three-day low near $3,370 during the early European session. Risk-on sentiment, driven by optimism around the US-Japan trade deal and progress in US-EU tariff talks, weakened safe-haven demand, leading to follow-through selling in gold for a second consecutive day.
Meanwhile, a modest rebound in the US Dollar from multi-week lows added pressure on gold. However, lingering uncertainty over the Fed’s rate-cut outlook and concerns over central bank independence may limit USD strength and provide some support for gold in the near term. Traders now await global flash PMI data and key US macro releases for fresh direction.
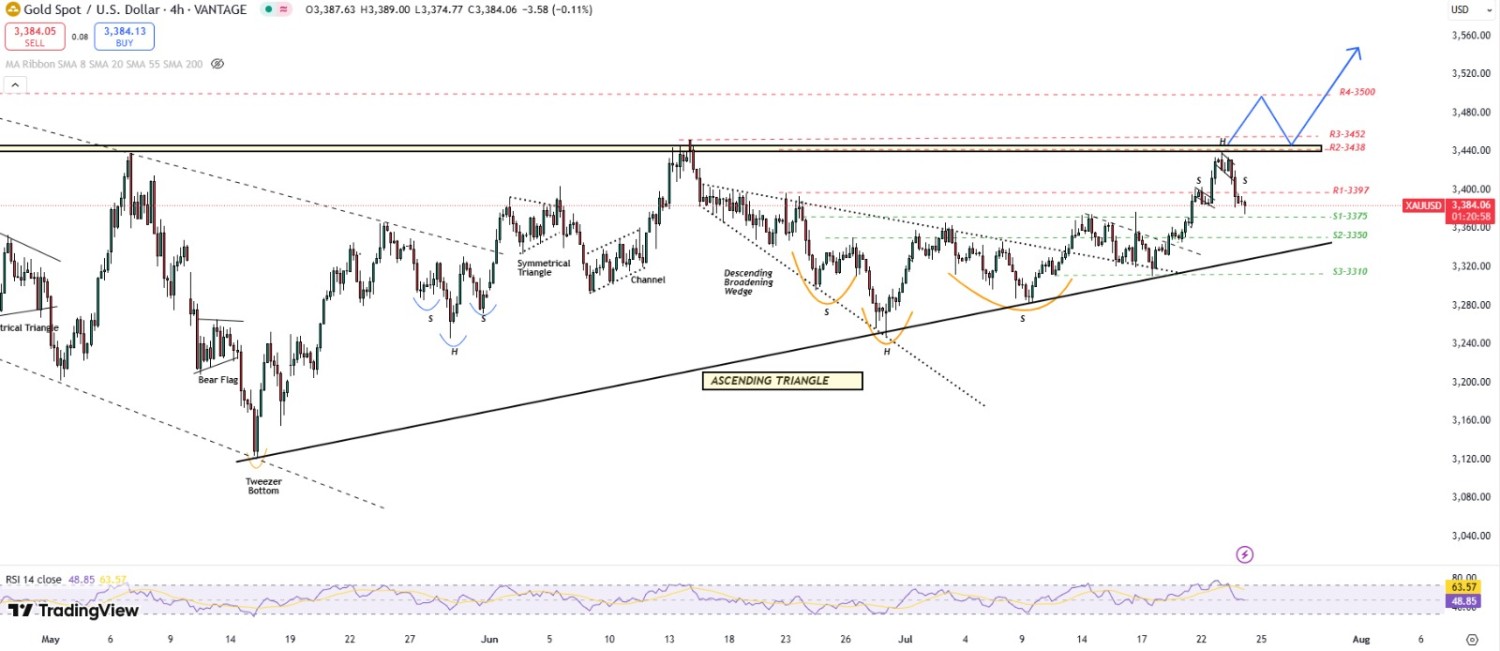
XAU/USD TECHNICAL OVERVIEW
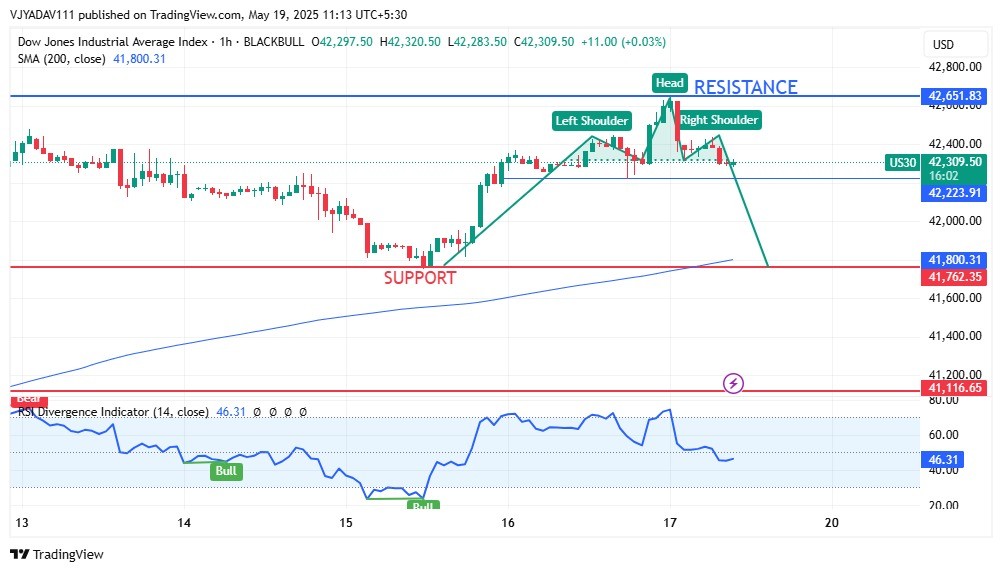
Technical Structure: Gold displays a mixed technical structure, with a Bearish Engulfing pattern on the daily chart, despite holding above the 20-day Simple moving average. On the 4-hour chart, a Doji candle indicates indecision, while the 1-hour chart reveals a potential Head & Shoulder pattern, suggesting a possible short term reversal.
Weekly Trend: Neutral
Intraday Trend/ Intraday Strategy: The intraday bias remains bearish and favours the approach of Selling on Support Breakdown and Selling on Rise
Major Support: 3370, 3350, 3330
Major Resistance: 3397, 3420, 3438
Recent News
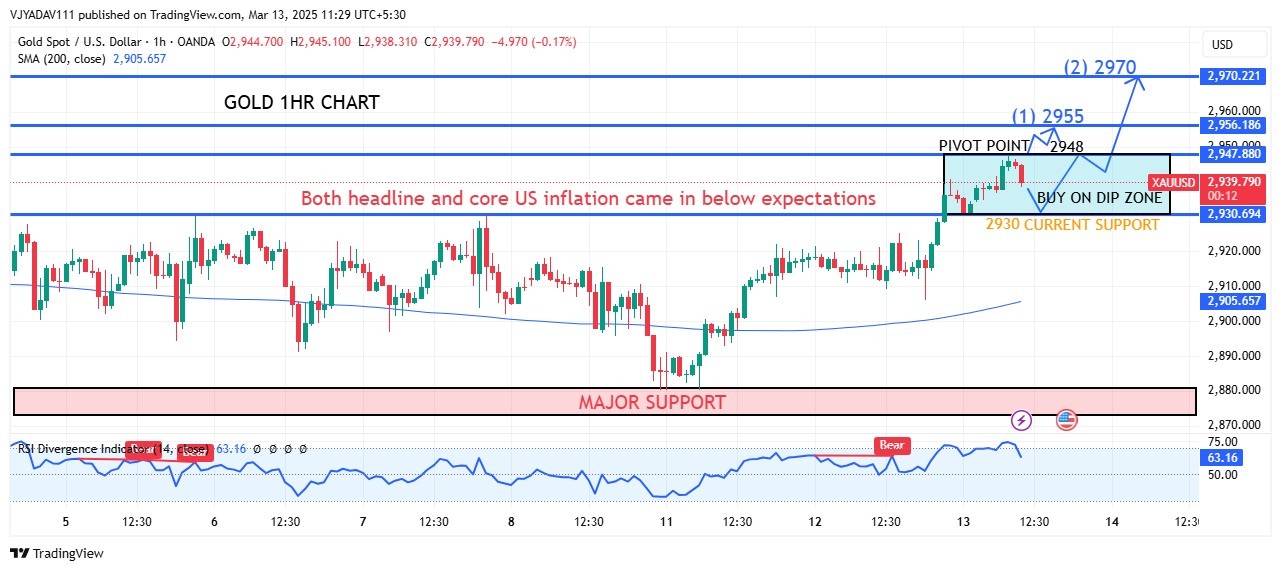
Gold Prices Steady as Inflation Risks Lo...
March 13, 2025
Market Insights
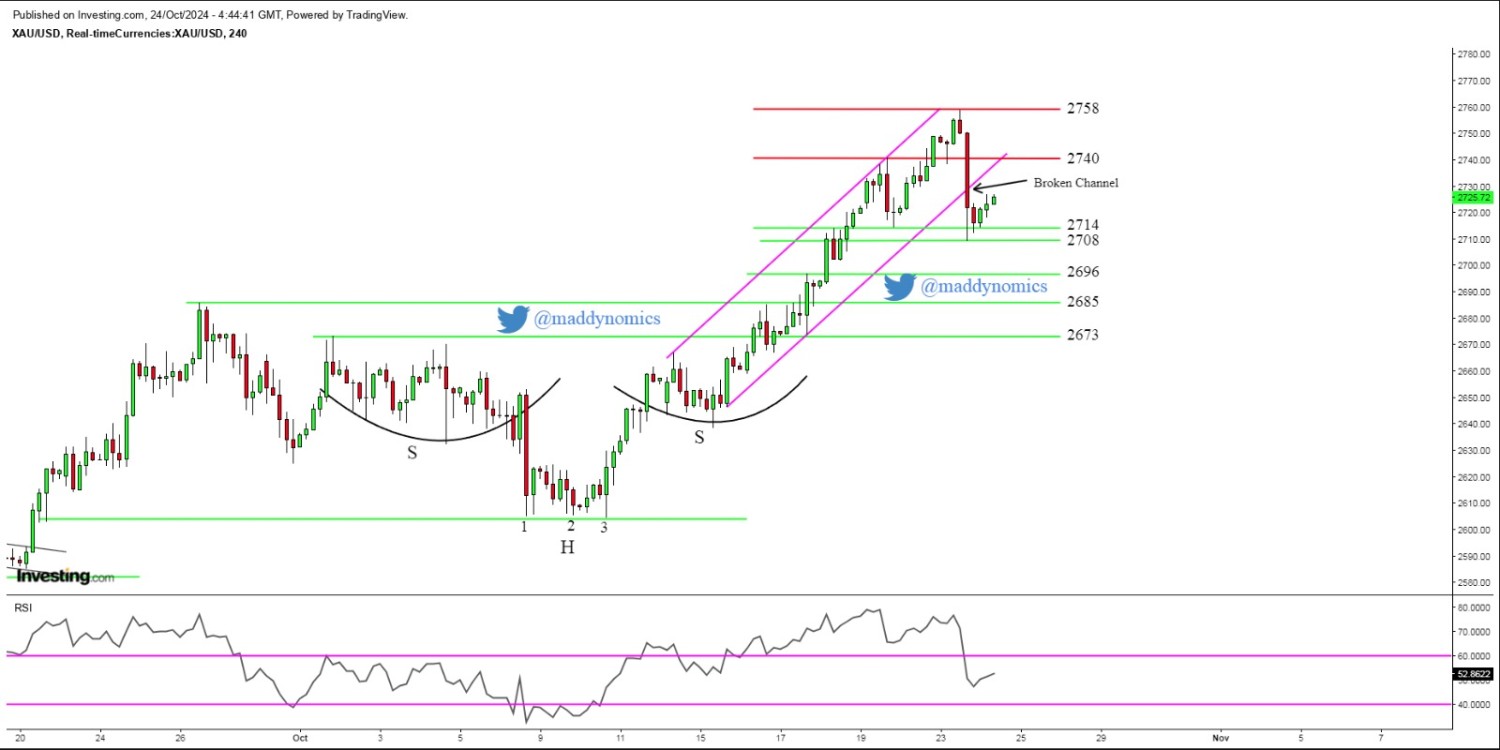
Gold attracts buyers in early European S...
October 24, 2024
Market Insights
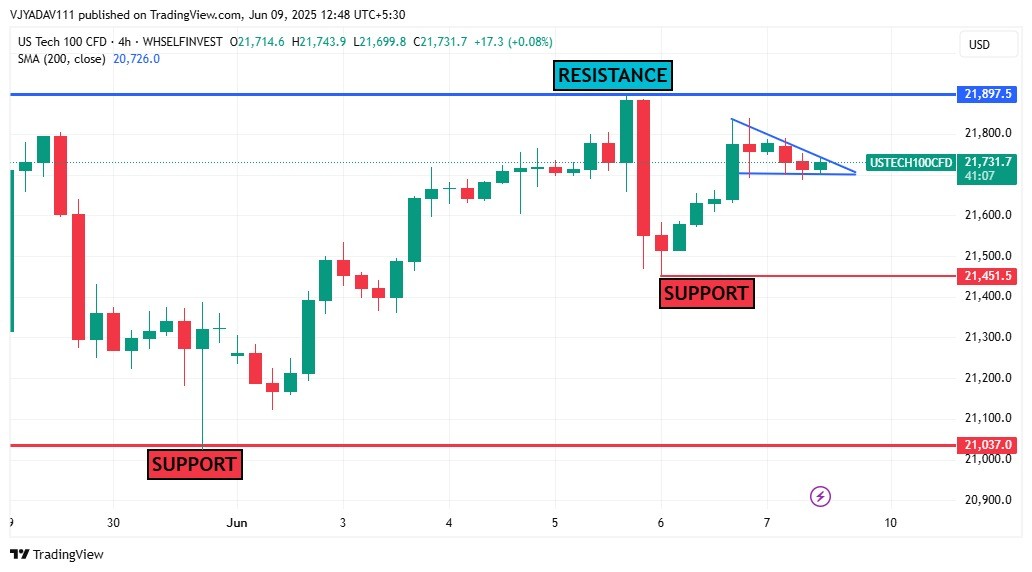
US Tech 100 Testing Key Levels Resistanc...
June 09, 2025
Market Insights

GBPUSD waiting for Official Bank Rate
December 19, 2024
Market Insights

Gold Drops Over 2% as Trump Eyes Copper...
February 26, 2025
Market Insights
Head and Shoulders Pattern Signals Poten...
May 19, 2025
Market Insights