GBP/USD Eyes Bullish Breakout Amid Softer US Dollar and Strong UK GDP Data
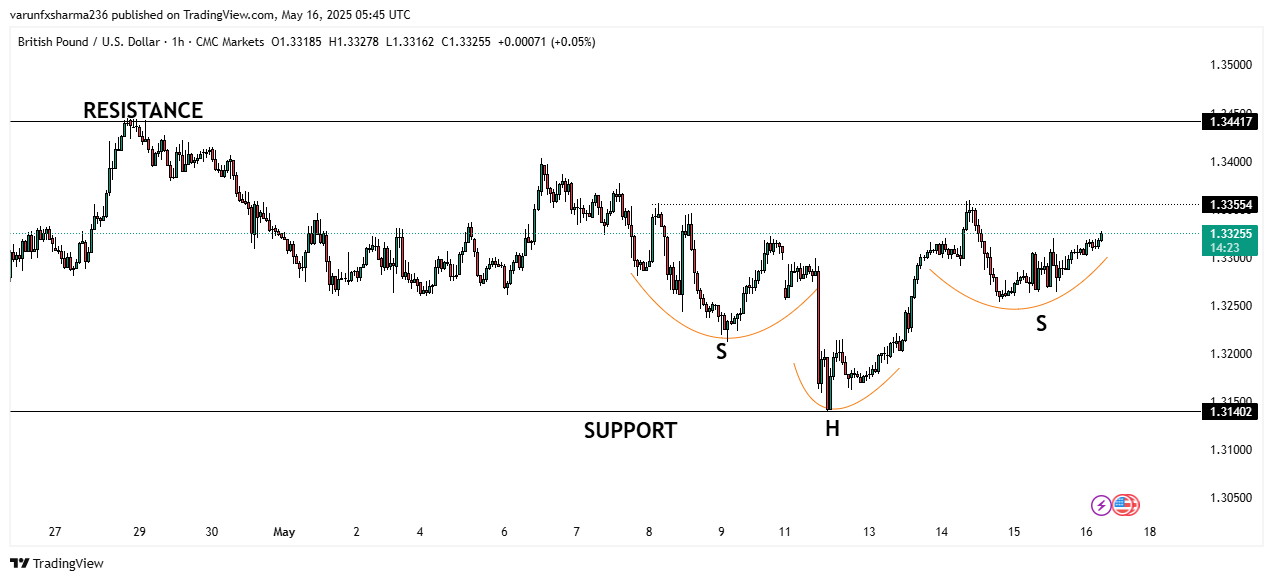
Chart Analysis: Inverse Head and Shoulders Pattern Signals Bullish Reversal
The 1-hour GBP/USD chart reveals a well-defined Inverse Head and Shoulders pattern forming above the key support level at 1.3140. This classic reversal pattern is marked by two higher lows (shoulders) and a deeper trough (head), indicating a potential shift from a downtrend to an uptrend.
-
Support Zone: 1.3140
-
Resistance Zone: 1.3355 – 1.3441
-
Pattern Neckline: Near 1.3355
If the price breaks and sustains above the 1.3355 neckline resistance, it may confirm the bullish reversal, with upside targets around the 1.3440 area.
Recent News

DAX making H&S on long view.
November 15, 2024
Market Insights
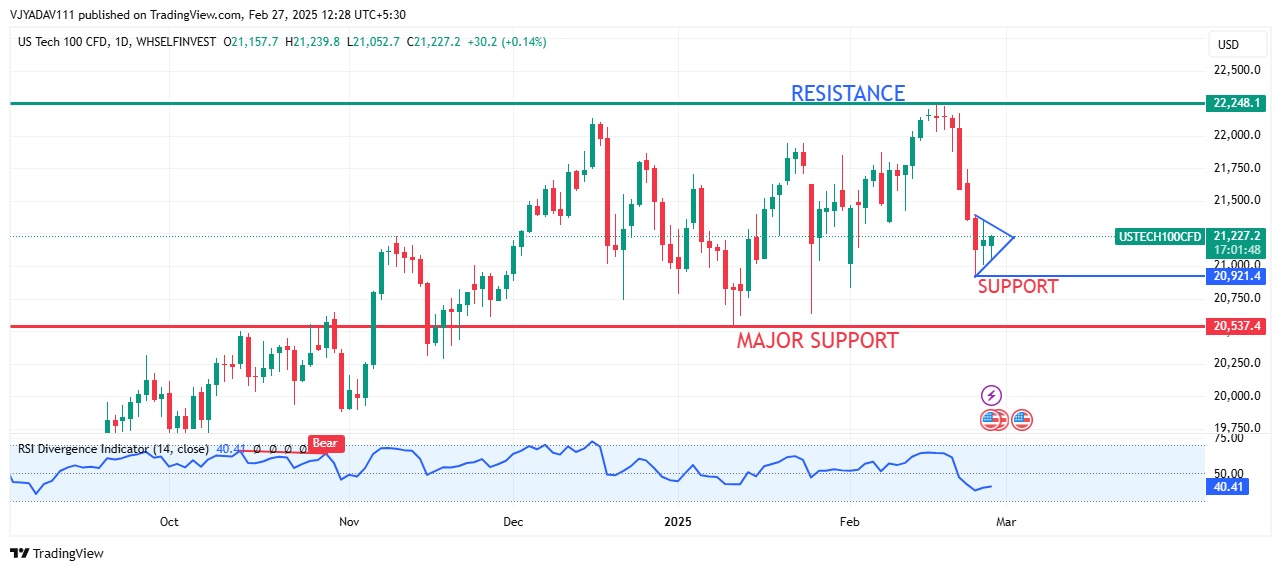
NASDAQ tumbles sharply from its all time...
February 27, 2025
Market Insights

AUDUSD made a Doji pattern on weekly tim...
November 04, 2024
Market Insights
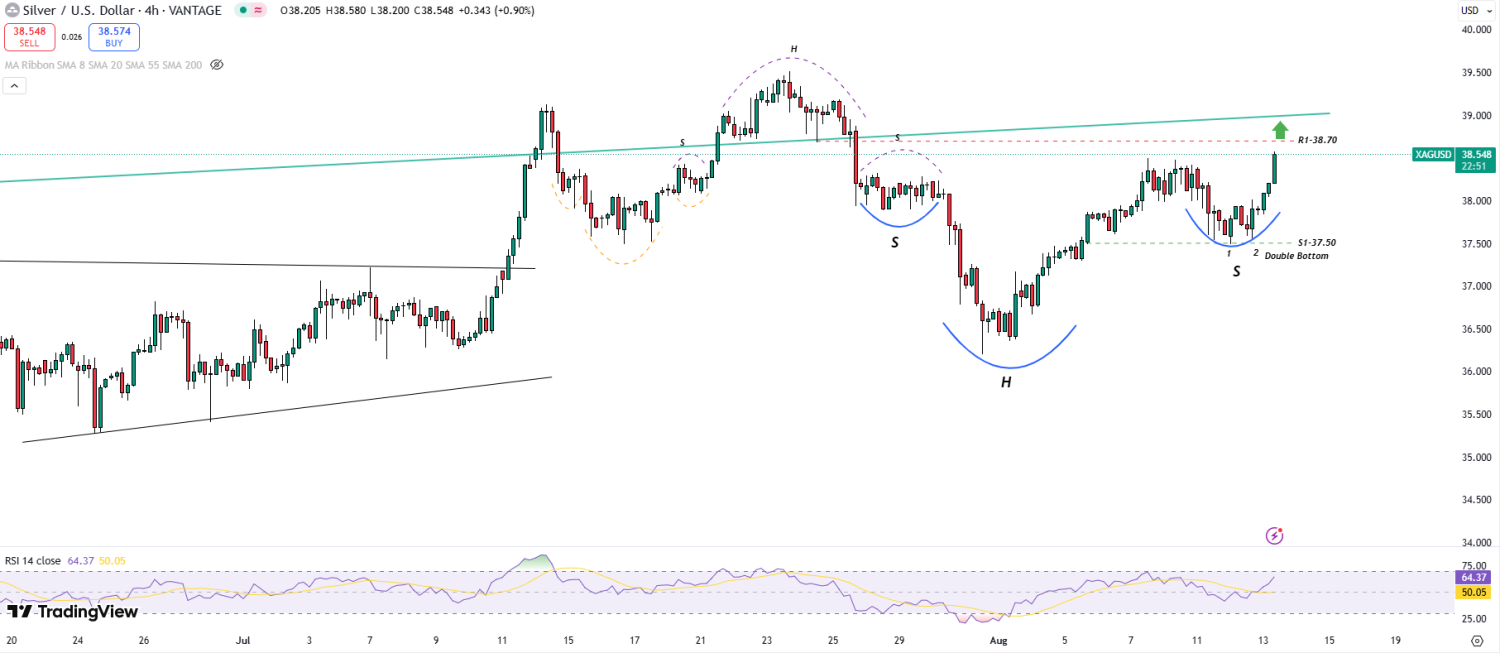
Silver forms massive Inverted Head & Sho...
August 13, 2025
Market Insights
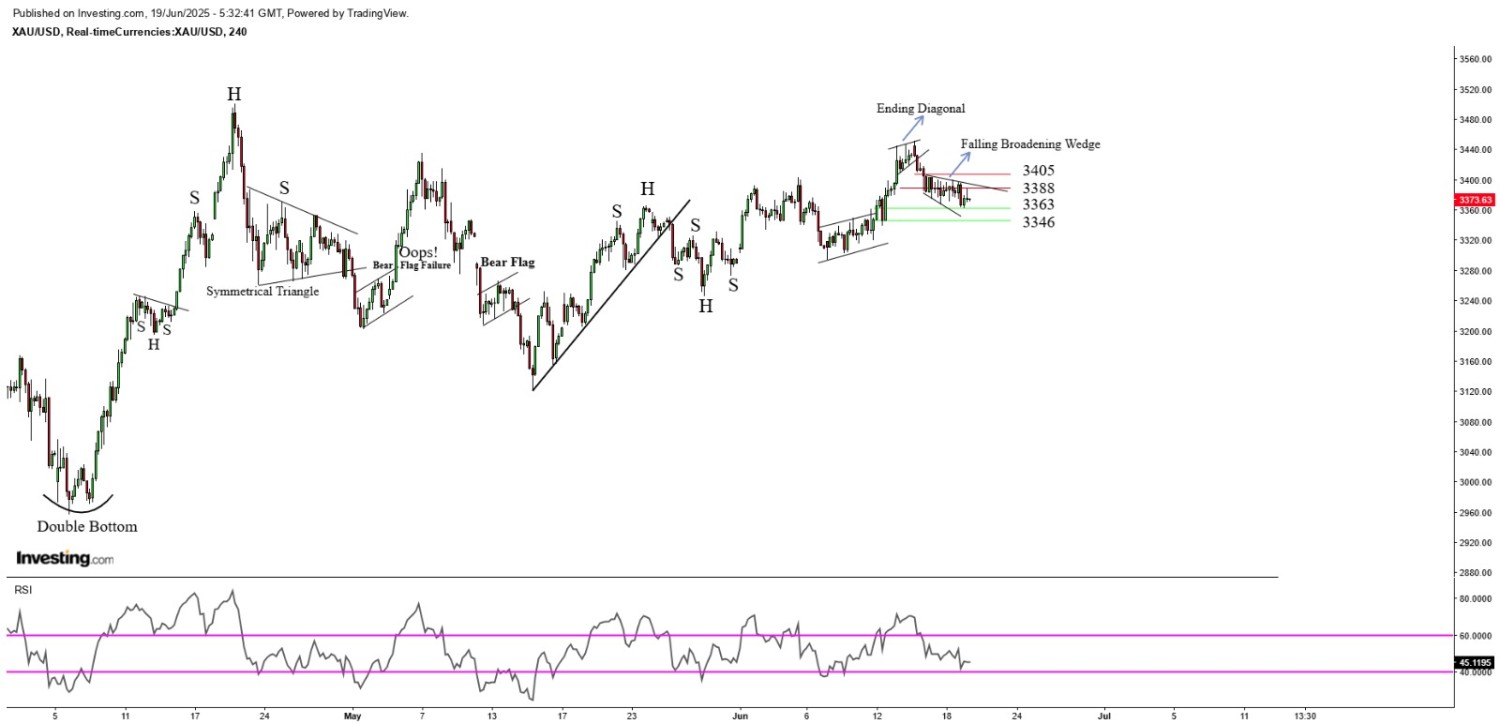
Gold recovers from weekly low amid safe-...
June 19, 2025
Market Insights
Gold tests the Top – Breakout from Desce...
July 11, 2025
Market Insights