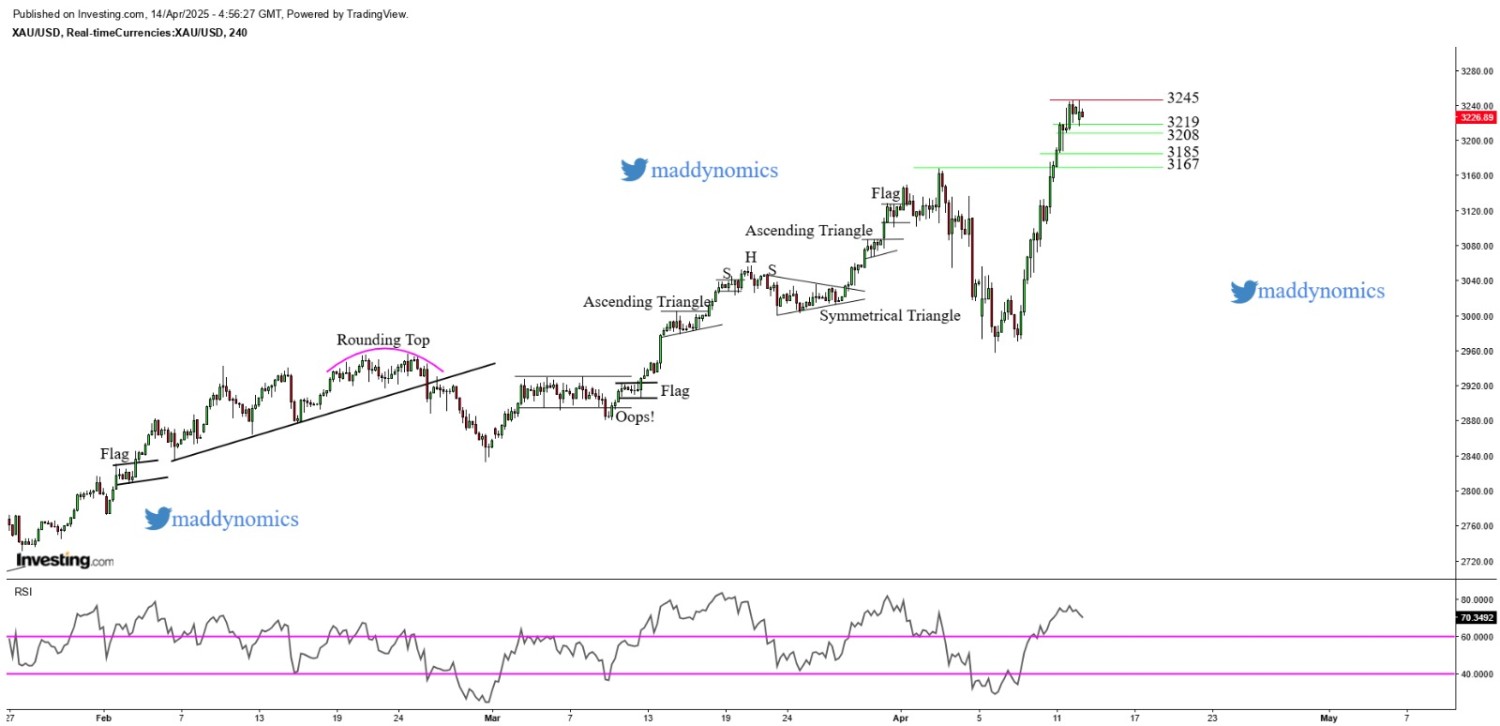
GBP/USD Breaks Out to Multi-Year Highs on Strong UK Retail Sales and Dollar Weakness
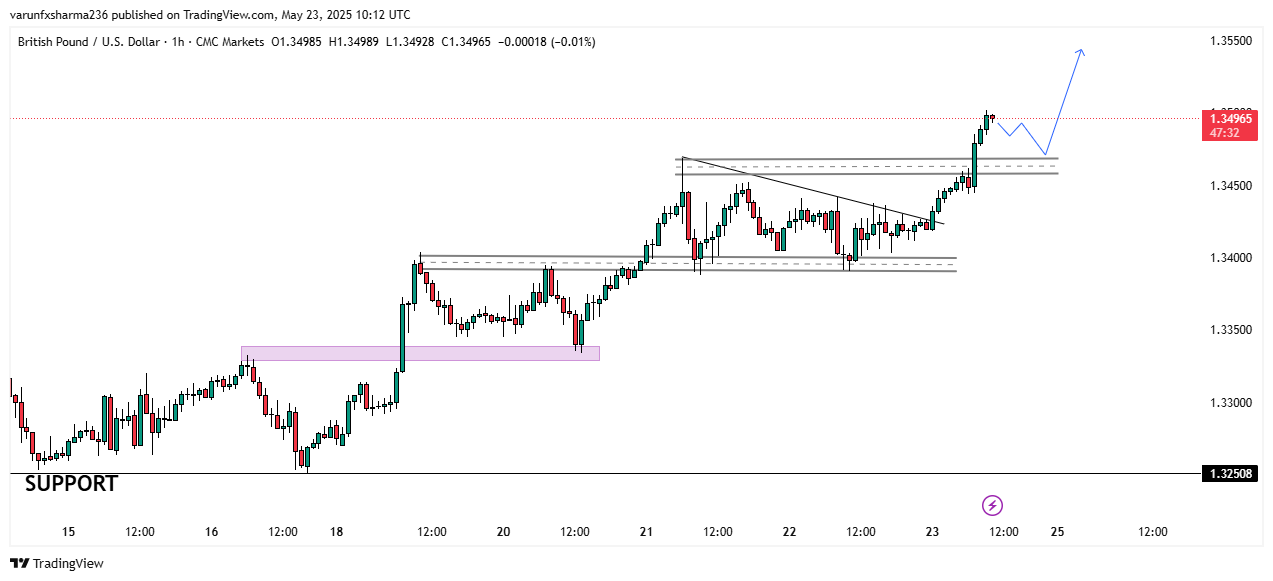
Chart Analysis:
-
The 1-hour chart shows a clear bullish structure, with successive higher highs and higher lows.
-
Price action has decisively broken above a descending trendline and key horizontal resistance near the 1.3460–1.3475 zone, now turning it into support.
-
A sharp bullish candle confirms the breakout, backed by strong volume and momentum.
-
The projected path in blue suggests a potential bullish flag or consolidation near the breakout level before another leg higher toward 1.3550, in line with continuation patterns.
Fundamental Tailwinds:
-
UK Retail Sales rose by 1.2% in April, vastly outperforming the expected 0.2%, signaling resilient consumer demand and adding fuel to the Pound's rally.
-
Meanwhile, the US Dollar is under pressure amid soft macroeconomic sentiment and growing expectations of a potential Fed rate cut, further strengthening GBP/USD.
Recent News
Gold regains momentum on rising safe-hav...
April 09, 2025
Market Insights
CRUDE OIL consolidation on weekly lover...
September 20, 2025
Market Insights
Dow Jones Breaks Key Support – Bearish P...
August 20, 2025
Market Insights
Dollar Index (DXY) Holds Above Key Pivot...
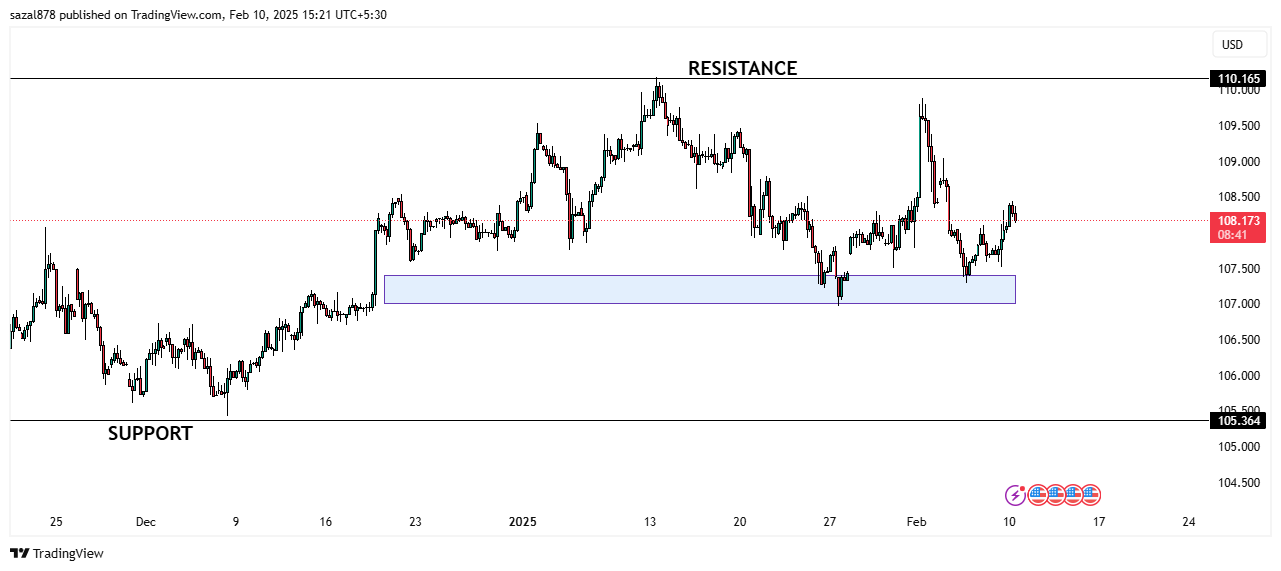
February 10, 2025
Market Insights
Gold price retreats from record highs as...
April 14, 2025
Market Insights
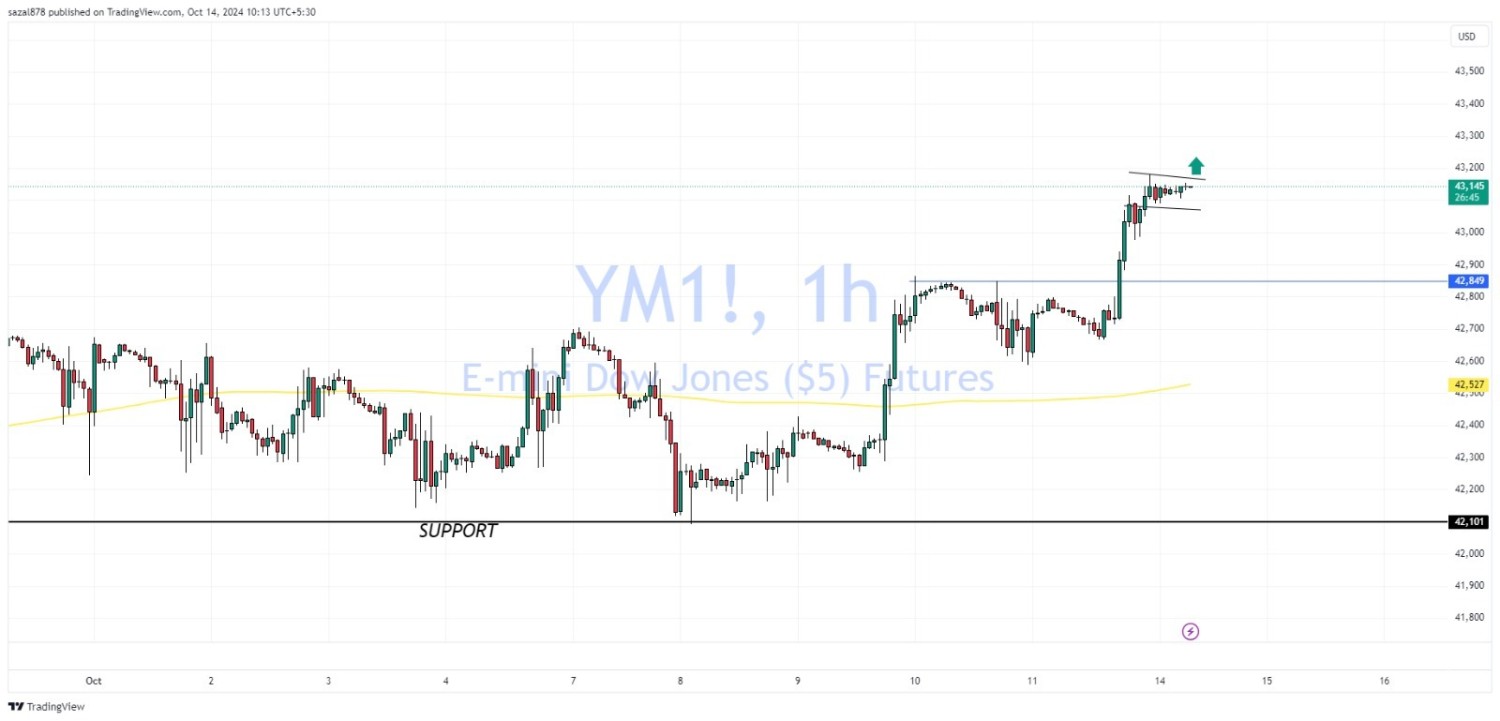
Dow Jones Analysis
October 14, 2024
Market Insights