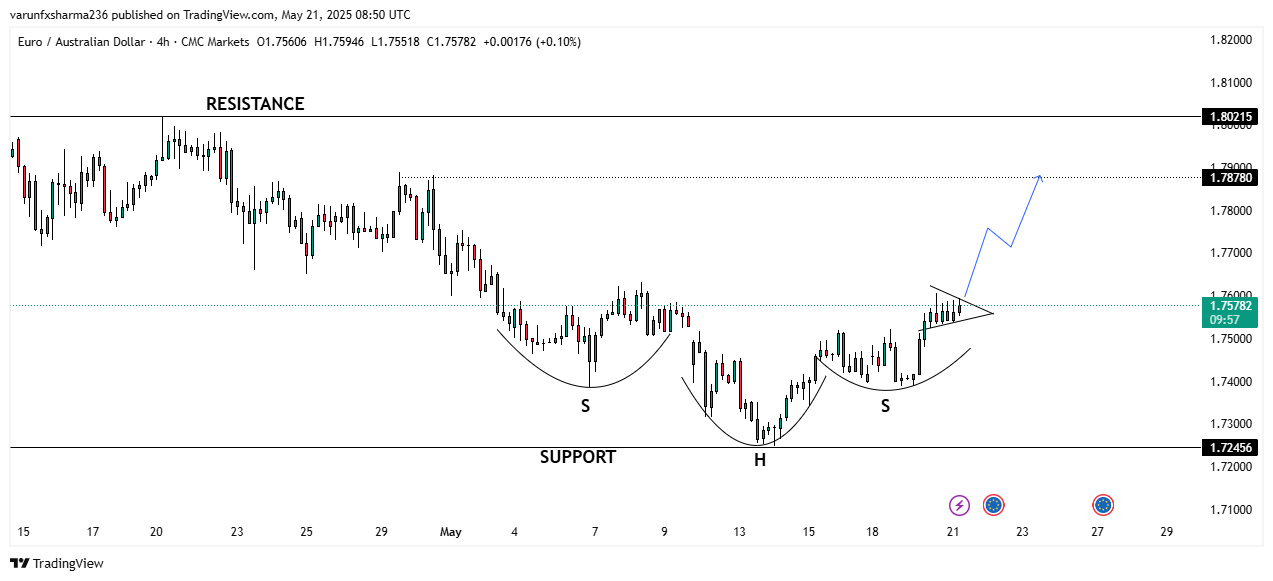
EUR/AUD – Bullish Reversal Pattern Indicates Potential Upside Move
Key Observations:
-
Pattern Structure:
-
The left shoulder (S) formed around May 4–6.
-
The head (H) is clearly visible at the low around May 12–13.
-
The right shoulder (S) was completed around May 17–19.
-
-
Neckline Breakout:
The price is now testing a neckline resistance zone, and a potential breakout to the upside is forming as the pair consolidates in a bullish symmetrical triangle. -
Support & Resistance:
-
Support: 1.72456
-
Immediate Resistance: 1.78780
-
Major Resistance: 1.80215
-
-
Price Target:
If the breakout holds, the price could rally toward the 1.78780 level, which aligns with the projected height of the inverse head and shoulders pattern added to the breakout point. A further extension toward 1.80215 is possible if momentum sustains.
Recent News

CRUDE OIL facing Daily Resistance
December 30, 2024
Market Insights
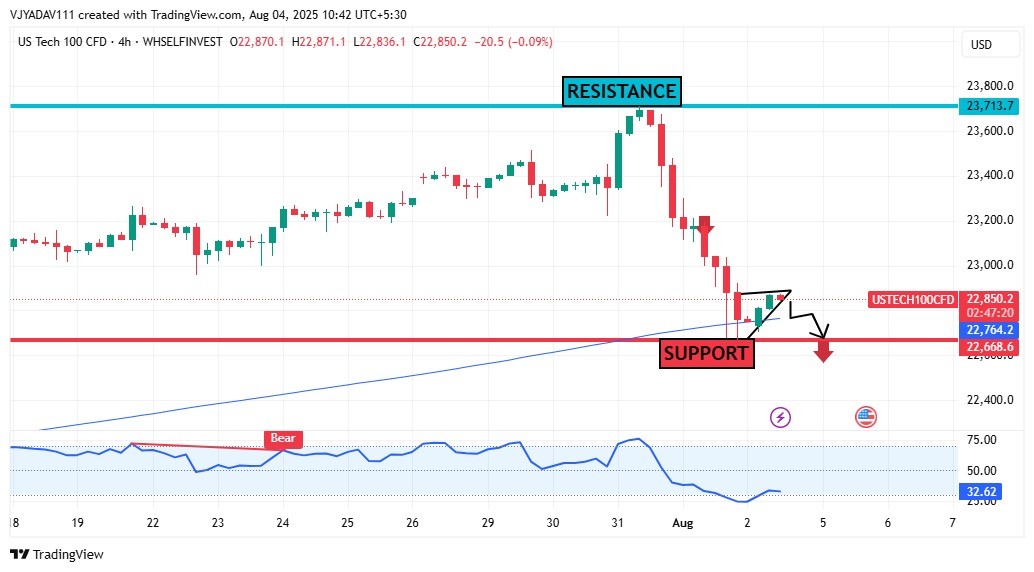
US100 forms bearish pennant near support...
August 04, 2025
Market Insights
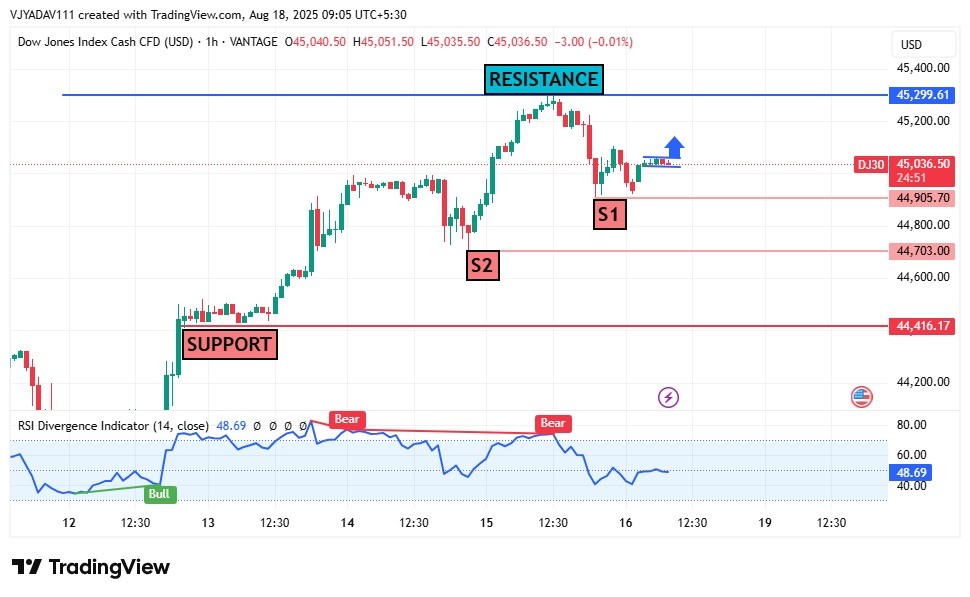
Dow Jones Eyes Recovery After Pullback K...
August 18, 2025
Market Insights
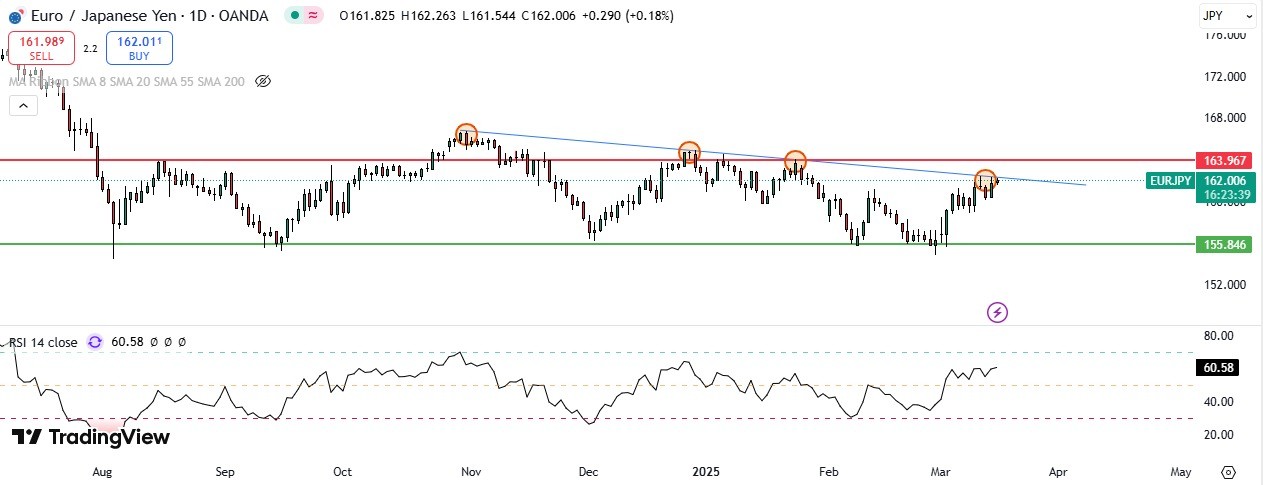
EUR/JPY extends gains to 162.00 level, f...
March 17, 2025
Market Insights
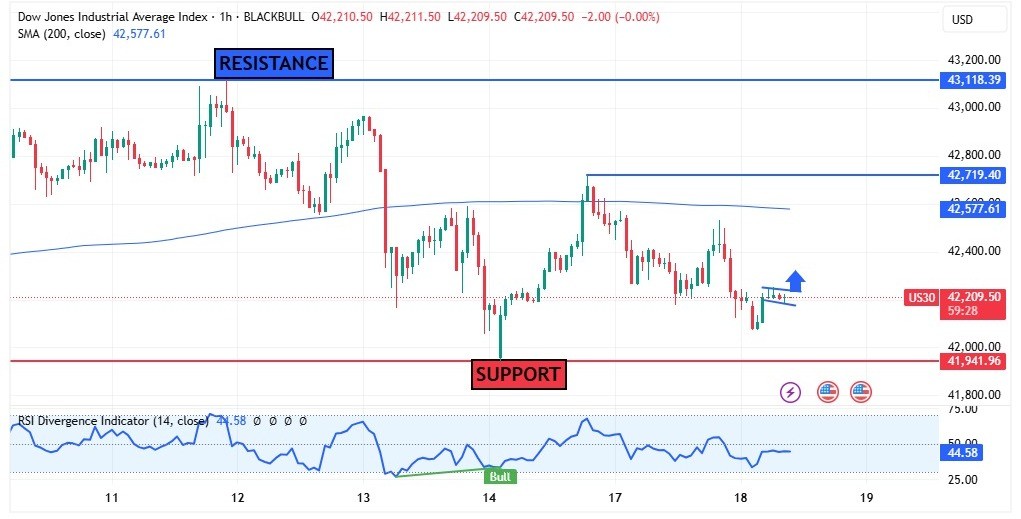
US30 TESTING SUPPORT LEVELS BULLISH RECO...
June 18, 2025
Market Insights
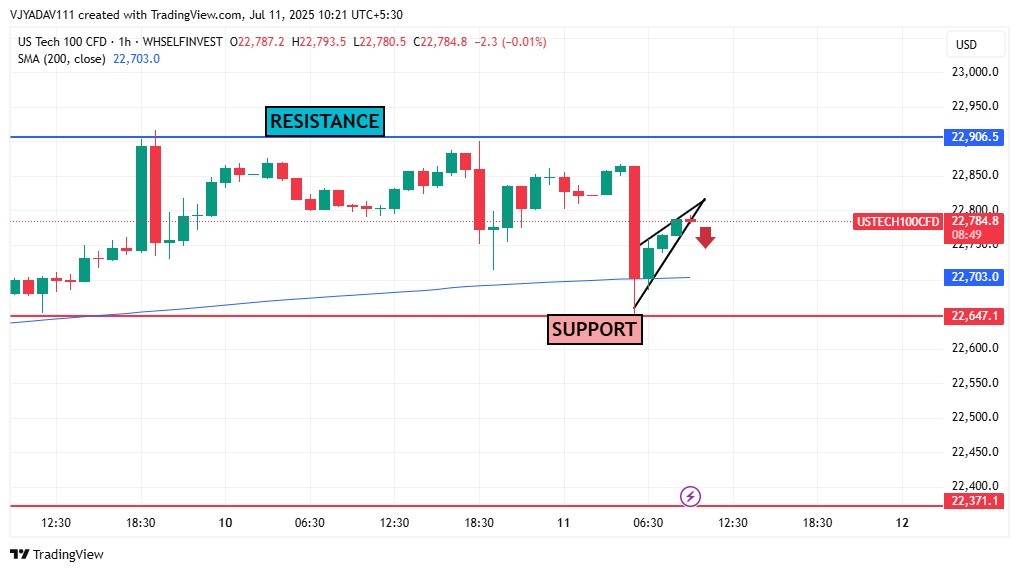
US Tech 100 Forms Bearish Flag – Breakdo...
July 11, 2025
Market Insights