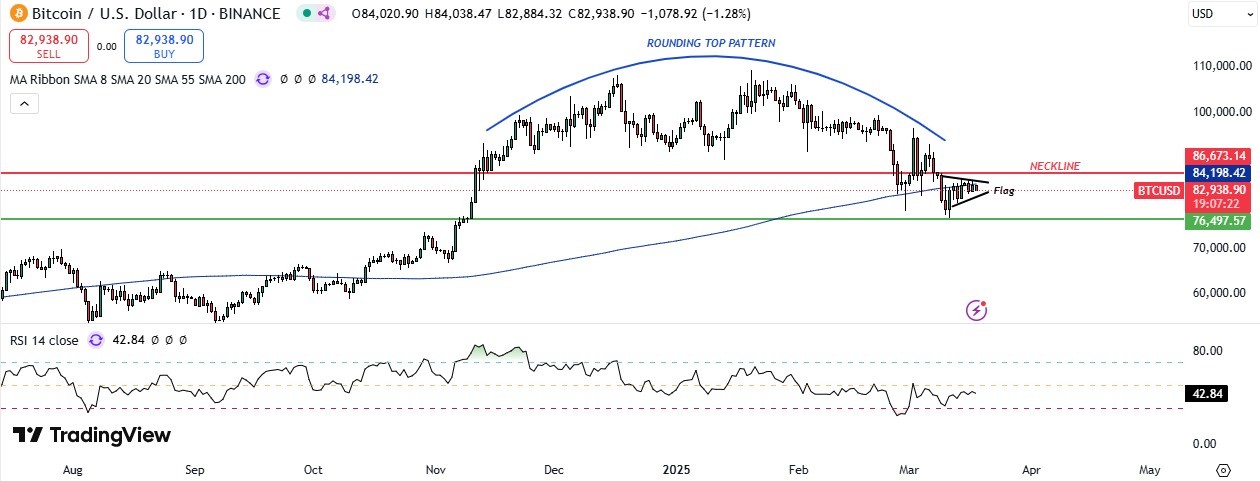
Bitcoin remains capped under $84000, lacks bullish momentum.
Bitcoin prices are often linked with giant tech stocks and Nasdaq's price movement. According to Peter Schiff's prediction, Nasdaq's decline could pose a threat on bitcoin prices. Furthermore, US Spot Bitcoin ETFs experienced over $1.6 billion of outflows in the first half of March amid trade war tensions and economic uncertainty, putting pressure on bitcoin prices.
Technically, there is no sign of further bullish momentum as prices struggle to breach the psychological resistance of $90000 above which bitcoin would resume its rally in the positive direction. On the downside, breaking the key support zone of $76000-$72000 would result in massive correction.
BITCOIN DAILY TECHNICAL OVERVIEW
Technical Structure: Rounding top on daily, Below 200 SMA, Bearish flag on daily, Consolidation on 1H.
Weekly Trend: Downtrend
Intraday Trend/ Intraday Strategy: Bearish/ Sell on Support breakdown
Major Support: 82000, 79000, 76000
Major Resistance: 86500, 90000, 94500
Recent News
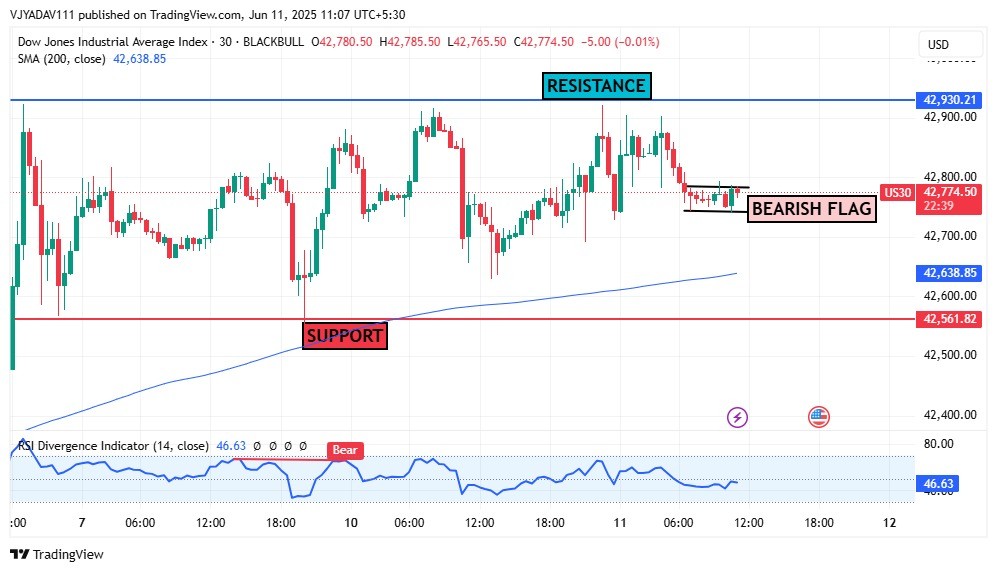
Dow Jones Forms Bearish Flag Near Resist...
June 11, 2025
Market Insights

How high can Bitcoin go? Prediction mark...
November 12, 2024
Market Insights

Daily Structure: Bullish Flag formation;...
September 09, 2025
Market Insights
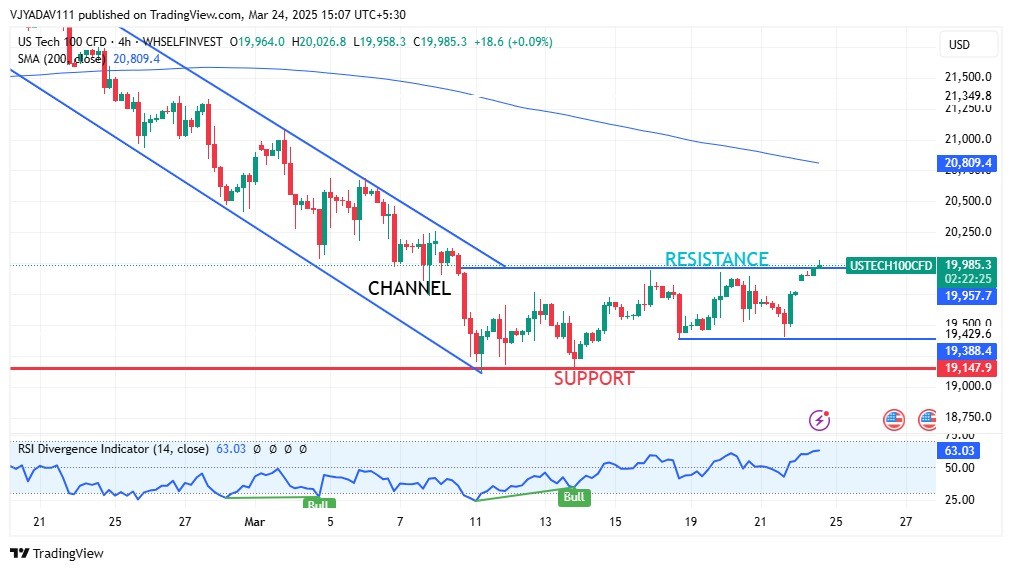
US Tech 100 Breaks Out of Downward Chann...
March 24, 2025
Market Insights
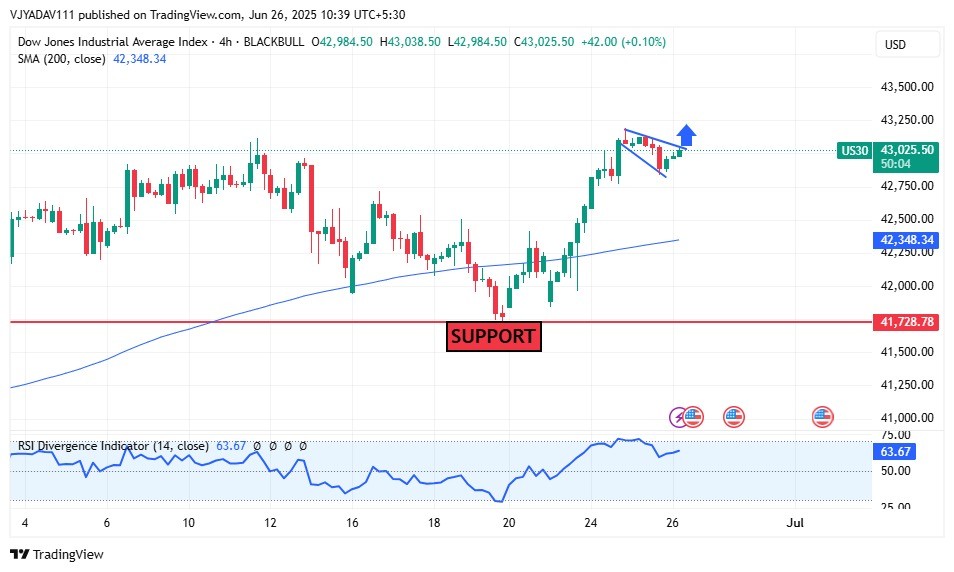
Dow Jones Signals Bullish Momentum Suppo...
June 26, 2025
Market Insights
Gold Price Drops to $3,000 Amid Geopolit...
March 24, 2025
Market Insights